OXY has run up quite well, especially with the help of heavy buying from Warren Buffet and his conglomerate.
Is it set up for a downturn?
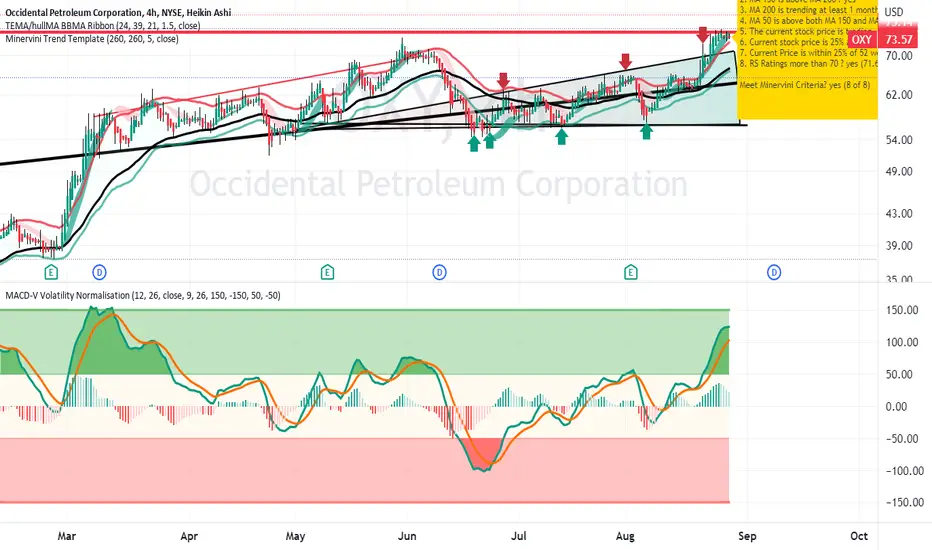
On the chart, the red horizontal line is the market high pre-Covid.
The MACD a lagging indicator has the K and D lines in early convergence
well above the histogram.
Time will tell but OXY might be pulling back into a better price for buying.
Is it set up for a downturn?
On the chart, the red horizontal line is the market high pre-Covid.
The MACD a lagging indicator has the K and D lines in early convergence
well above the histogram.
Time will tell but OXY might be pulling back into a better price for buying.
Trade active
OXY as dropped from $74 to $69 consistent with the idea. Put options have paid well. Partial profit was taken off the table.Disclaimer
The information and publications are not meant to be, and do not constitute, financial, investment, trading, or other types of advice or recommendations supplied or endorsed by TradingView. Read more in the Terms of Use.
Disclaimer
The information and publications are not meant to be, and do not constitute, financial, investment, trading, or other types of advice or recommendations supplied or endorsed by TradingView. Read more in the Terms of Use.