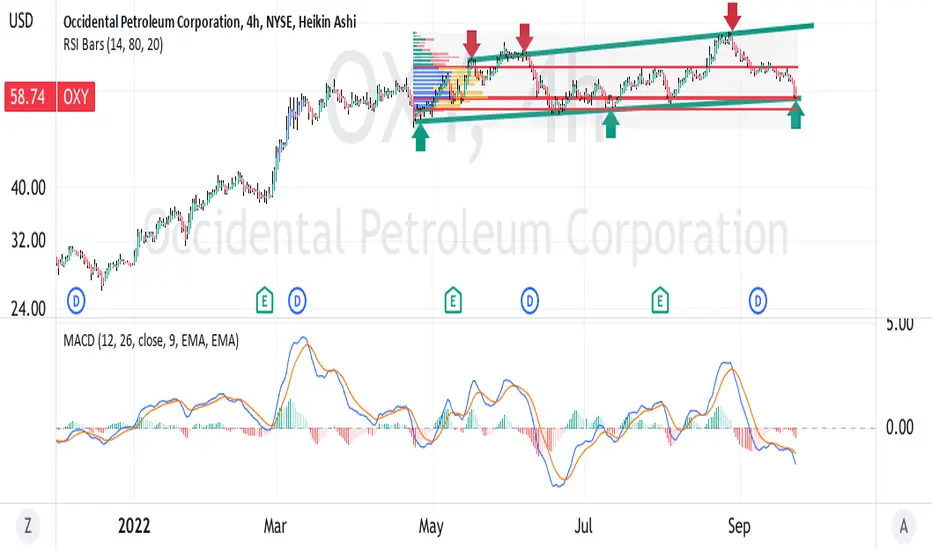
On the 4H OXY is in a long up trend in part supported by the buy of Mr. Buffett
In the intermediate term as shown on the chart, it is in a slowly rising parallel channel
while at present it is at the bottom of the channel sitting on the POC of the long term
volume profile and near to the lower Bollinger Band. I see this as a buy low sell high
opportunity, The is confirmed with the MACD a lagging indicator with the lines below
the histogram and not yet crossing over. Spot oil may be at a pivot point and
OXY is setting up long.
Disclaimer
The information and publications are not meant to be, and do not constitute, financial, investment, trading, or other types of advice or recommendations supplied or endorsed by TradingView. Read more in the Terms of Use.
Disclaimer
The information and publications are not meant to be, and do not constitute, financial, investment, trading, or other types of advice or recommendations supplied or endorsed by TradingView. Read more in the Terms of Use.