Cybersecurity firm Palo Alto Networks  PANW will report fiscal Q4 results next week at a time when the stock is up 300%+ over five years, but down some 4% year to date. What does PANW's fundamental and technical analysis say?
Let's take a look:
Palo Alto Networks' Fundamental Analysis
PANW, CrowdStrike Holdings CRWD and Zscaler
  ZS are arguably the "Big Three" cloud-based, AI-assisted software cybersecurity platforms -- a group that's done well over the past year, but has been under pressure in recent weeks.
PANW has lost some 16% since its July 29 intraday peak, while CRWD has shed about 18% since its July 3 near-term top and ZS has given back 15% since its July 8 session high.
The group has pulled back even as the S&P 500 and Nasdaq Composite set new all-time highs. Cybersecurity firms have suffered as passive capital has been pulled from software in general.
However, that could change when the group reports quarterly earnings, starting with Palo Alto Networks.
PANW will release fiscal Q4 results next Monday after the bell, with analysts' consensus estimate calling for the firm to disclose $0.89 in adjusted earnings per share on $2.5 billion of revenue.
That would represent an 18.7% gain from the $0.75 in adjusted EPS that PANW reported in the same period last year, as well as a roughly 14% growth from the year-ago quarter's $2.2 billion in revenue.
In fact, Palo Alto Networks has reported 12%-15% year-over-year sales growth for five consecutive quarters.
Brad Zelnick of Deutsche Bank this week upgraded PANW to a "Buy" from a from a "Hold" this week, while increasing the stock's price target to $220 from an earlier $200.
Six other analysts also reiterated "Buy" or "Buy-Equivalent" ratings on Palo Alto Networks this week, with one increasing his price target to $225 from a prior $200.
That said, Roger Boyd of UBS recently took his PANW price target down to $185 from a previous $200, although the analyst reiterated his "Hold" grading of the stock.
All in, these eight analysts have collectively assigned Palo Alto Networks a $219.63 average target price vs. the $174.68 PANW was trading at Friday morning.
And interestingly, of the 44 sell-side analysts that I can find that cover PANW, 37 have revised their earnings estimates for the quarter higher since the period began. Just one has lowered his numbers, while six left their forecasts unchanged.
Palo Alto Networks' Technical Analysis
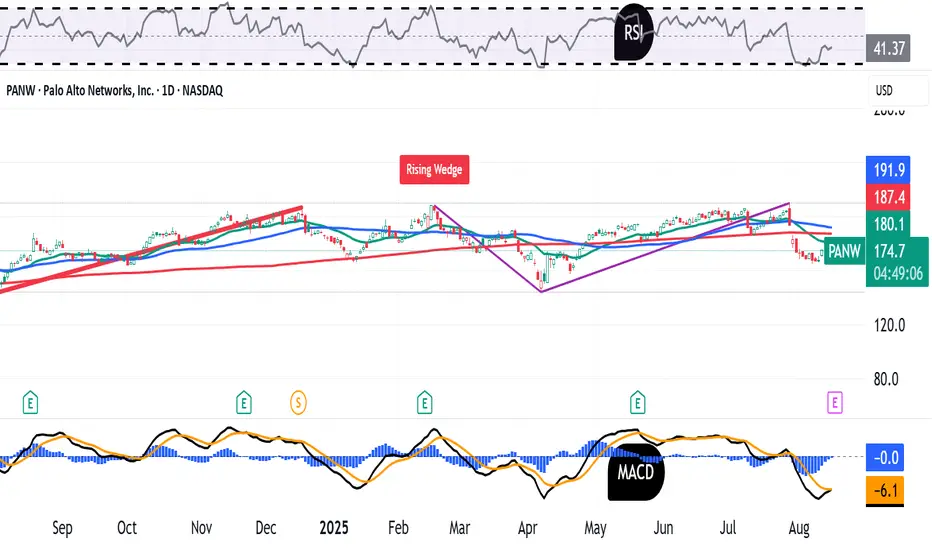
Now let's check out PANW's chart going back 12 months and running through Wednesday afternoon:

Readers will first notice that this chart shows an overarching "Triple Top" pattern of bearish reversal that began in earnest about a year ago.
This pattern's "neckline" or "pivot" is at $144 -- much lower than PANW's $174.68 Friday morning price. So, the chart is showing some risk for the stock.
On the other hand, PANW is looking to possibly test its 21-day Exponential Moving Average, or "EMA," marked by green line at $181.30 in chart above.
Taking that line could get the swing crowd behind Palo Alto Networks and potentially allow for a run at the stock's all-important 200-day Simple Moving Average, or "SMA" (denoted with a red line at $187.40 above).
Meanwhile, PANW's Relative Strength Index (or "RSI," marked with a gray line at the chart's top) is off of its weakest readings and approaching a more neutral level.
Similarly, the stock's daily Moving Average Convergence Divergence indication (or "MACD," denoted by black and gold lines and blue bars at the chart's bottom) has been weak, but appears to be strengthening going into earnings.
The histogram of the stock's 9-day EMA (the blue bars) is still in negative territory, but is ascending towards the zero-bound rather quickly.
Similarly, the 12-day EMA (the black line) is curling up towards the stock's 26-day EMA (the gold line). Although both are still in negative territory, a crossover there would be technically helpful for the bulls.
(Moomoo Technologies Inc. Markets Commentator Stephen “Sarge” Guilfoyle was long PANW and CRWD at the time of writing this column.)
This article discusses technical analysis, other approaches, including fundamental analysis, may offer very different views. The examples provided are for illustrative purposes only and are not intended to be reflective of the results you can expect to achieve. Specific security charts used are for illustrative purposes only and are not a recommendation, offer to sell, or a solicitation of an offer to buy any security. Past investment performance does not indicate or guarantee future success. Returns will vary, and all investments carry risks, including loss of principal. This content is also not a research report and is not intended to serve as the basis for any investment decision. The information contained in this article does not purport to be a complete description of the securities, markets, or developments referred to in this material. Moomoo and its affiliates make no representation or warranty as to the article's adequacy, completeness, accuracy or timeliness for any particular purpose of the above content. Furthermore, there is no guarantee that any statements, estimates, price targets, opinions or forecasts provided herein will prove to be correct.
Moomoo is a financial information and trading app offered by Moomoo Technologies Inc. In the U.S., investment products and services on Moomoo are offered by Moomoo Financial Inc., Member FINRA/SIPC.
TradingView is an independent third party not affiliated with Moomoo Financial Inc., Moomoo Technologies Inc., or its affiliates. Moomoo Financial Inc. and its affiliates do not endorse, represent or warrant the completeness and accuracy of the data and information available on the TradingView platform and are not responsible for any services provided by the third-party platform.
Let's take a look:
Palo Alto Networks' Fundamental Analysis
PANW, CrowdStrike Holdings
PANW has lost some 16% since its July 29 intraday peak, while CRWD has shed about 18% since its July 3 near-term top and ZS has given back 15% since its July 8 session high.
The group has pulled back even as the S&P 500 and Nasdaq Composite set new all-time highs. Cybersecurity firms have suffered as passive capital has been pulled from software in general.
However, that could change when the group reports quarterly earnings, starting with Palo Alto Networks.
PANW will release fiscal Q4 results next Monday after the bell, with analysts' consensus estimate calling for the firm to disclose $0.89 in adjusted earnings per share on $2.5 billion of revenue.
That would represent an 18.7% gain from the $0.75 in adjusted EPS that PANW reported in the same period last year, as well as a roughly 14% growth from the year-ago quarter's $2.2 billion in revenue.
In fact, Palo Alto Networks has reported 12%-15% year-over-year sales growth for five consecutive quarters.
Brad Zelnick of Deutsche Bank this week upgraded PANW to a "Buy" from a from a "Hold" this week, while increasing the stock's price target to $220 from an earlier $200.
Six other analysts also reiterated "Buy" or "Buy-Equivalent" ratings on Palo Alto Networks this week, with one increasing his price target to $225 from a prior $200.
That said, Roger Boyd of UBS recently took his PANW price target down to $185 from a previous $200, although the analyst reiterated his "Hold" grading of the stock.
All in, these eight analysts have collectively assigned Palo Alto Networks a $219.63 average target price vs. the $174.68 PANW was trading at Friday morning.
And interestingly, of the 44 sell-side analysts that I can find that cover PANW, 37 have revised their earnings estimates for the quarter higher since the period began. Just one has lowered his numbers, while six left their forecasts unchanged.
Palo Alto Networks' Technical Analysis
Now let's check out PANW's chart going back 12 months and running through Wednesday afternoon:
Readers will first notice that this chart shows an overarching "Triple Top" pattern of bearish reversal that began in earnest about a year ago.
This pattern's "neckline" or "pivot" is at $144 -- much lower than PANW's $174.68 Friday morning price. So, the chart is showing some risk for the stock.
On the other hand, PANW is looking to possibly test its 21-day Exponential Moving Average, or "EMA," marked by green line at $181.30 in chart above.
Taking that line could get the swing crowd behind Palo Alto Networks and potentially allow for a run at the stock's all-important 200-day Simple Moving Average, or "SMA" (denoted with a red line at $187.40 above).
Meanwhile, PANW's Relative Strength Index (or "RSI," marked with a gray line at the chart's top) is off of its weakest readings and approaching a more neutral level.
Similarly, the stock's daily Moving Average Convergence Divergence indication (or "MACD," denoted by black and gold lines and blue bars at the chart's bottom) has been weak, but appears to be strengthening going into earnings.
The histogram of the stock's 9-day EMA (the blue bars) is still in negative territory, but is ascending towards the zero-bound rather quickly.
Similarly, the 12-day EMA (the black line) is curling up towards the stock's 26-day EMA (the gold line). Although both are still in negative territory, a crossover there would be technically helpful for the bulls.
(Moomoo Technologies Inc. Markets Commentator Stephen “Sarge” Guilfoyle was long PANW and CRWD at the time of writing this column.)
This article discusses technical analysis, other approaches, including fundamental analysis, may offer very different views. The examples provided are for illustrative purposes only and are not intended to be reflective of the results you can expect to achieve. Specific security charts used are for illustrative purposes only and are not a recommendation, offer to sell, or a solicitation of an offer to buy any security. Past investment performance does not indicate or guarantee future success. Returns will vary, and all investments carry risks, including loss of principal. This content is also not a research report and is not intended to serve as the basis for any investment decision. The information contained in this article does not purport to be a complete description of the securities, markets, or developments referred to in this material. Moomoo and its affiliates make no representation or warranty as to the article's adequacy, completeness, accuracy or timeliness for any particular purpose of the above content. Furthermore, there is no guarantee that any statements, estimates, price targets, opinions or forecasts provided herein will prove to be correct.
Moomoo is a financial information and trading app offered by Moomoo Technologies Inc. In the U.S., investment products and services on Moomoo are offered by Moomoo Financial Inc., Member FINRA/SIPC.
TradingView is an independent third party not affiliated with Moomoo Financial Inc., Moomoo Technologies Inc., or its affiliates. Moomoo Financial Inc. and its affiliates do not endorse, represent or warrant the completeness and accuracy of the data and information available on the TradingView platform and are not responsible for any services provided by the third-party platform.
Disclaimer
The information and publications are not meant to be, and do not constitute, financial, investment, trading, or other types of advice or recommendations supplied or endorsed by TradingView. Read more in the Terms of Use.
Disclaimer
The information and publications are not meant to be, and do not constitute, financial, investment, trading, or other types of advice or recommendations supplied or endorsed by TradingView. Read more in the Terms of Use.