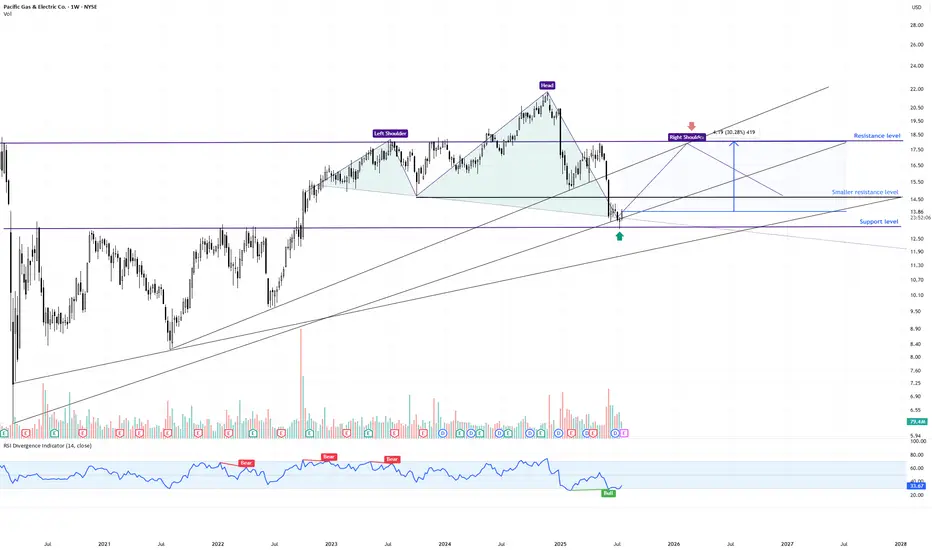
📍 Ticker: PCG (Pacific Gas & Electric Co.)
📆 Timeframe: 1W (Weekly)
💡 Pattern: Head & Shoulders Formation – Testing Neckline & Long-Term Support
📉 Price: $13.87 (current weekly level)
📊 Volume: 78M
📉 RSI: 33.7 → oversold zone brewing
🔍 What the Chart is Showing
PCG is in the late stages of a Head & Shoulders pattern, but the right shoulder is still developing. Price is now pressing into a critical confluence area where multiple factors intersect:
✅ Neckline zone from the potential H&S structure
✅ Multi-year ascending trendline support (2020 origin)
✅ Horizontal support cluster from 2022–2023 consolidation
✅ Weekly RSI hovering near oversold, hinting at possible bullish divergence
Importantly, the H&S is not yet confirmed – it would require a decisive weekly close below the neckline to trigger a textbook breakdown.
🧠 Swing Trade Scenarios
➡️ Bullish Reversal Scenario (Failed Breakdown)
🟢 Entry Zone: $13.60–$14.00
🎯 Target 1: $14.62 (initial resistance pivot) - close 30-70% of the position
🎯 Target 2: $17.80–$18.50 (major resistance) - close the another 30-70% of the position.
⛔️ Stop-Loss 1: Close below $13.20 (neckline break confirmation)
➡️ Bearish Breakdown Scenario (Pattern Confirmation)
❌ If PCG closes below $13.20 on the weekly, it confirms the H&S → opens downside toward $11.50 (the lowest trendline support)
⚠️ What Makes This Week Critical
📌 A hammer-like candle is forming – but needs a strong weekly close to indicate buyer absorption
📌 A close above $14.00 would weaken the H&S formation, hinting at a failed pattern
📌 A close below $13.20 would confirm the bearish continuation
This is a decision zone: either the right shoulder fails, triggering a deeper swing lower, or buyers defend and negate the pattern.
💬 Will PCG confirm the weekly H&S breakdown or trap bears with a failed pattern bounce?
✅ This week’s close will define the next major swing move!
LIKE & FOLLOW for more professional swing setups with clean risk/reward.
#PCG #SwingTrade #Utilities #TargetTraders #TechnicalAnalysis #HeadAndShoulders
Related publications
Disclaimer
The information and publications are not meant to be, and do not constitute, financial, investment, trading, or other types of advice or recommendations supplied or endorsed by TradingView. Read more in the Terms of Use.
Related publications
Disclaimer
The information and publications are not meant to be, and do not constitute, financial, investment, trading, or other types of advice or recommendations supplied or endorsed by TradingView. Read more in the Terms of Use.