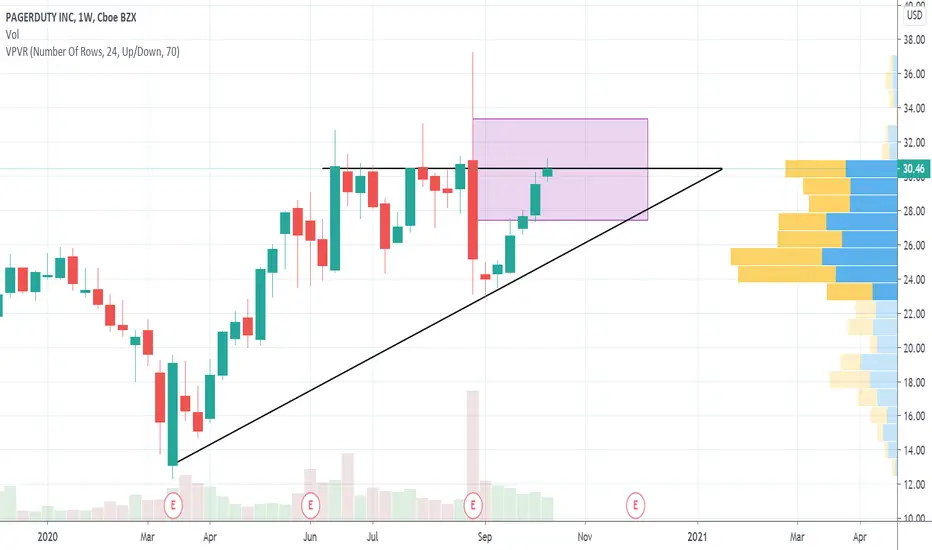
This is the weekly chart of PD. Purple box represents gap fill on the daily chart.
On Friday we saw a DIX (dark pool) of 89.54 for PD. Weekly chart is looking fantastic for a rip to the upside.
No position, but I am looking to go long via shares.
On Friday we saw a DIX (dark pool) of 89.54 for PD. Weekly chart is looking fantastic for a rip to the upside.
No position, but I am looking to go long via shares.
Disclaimer
The information and publications are not meant to be, and do not constitute, financial, investment, trading, or other types of advice or recommendations supplied or endorsed by TradingView. Read more in the Terms of Use.
Disclaimer
The information and publications are not meant to be, and do not constitute, financial, investment, trading, or other types of advice or recommendations supplied or endorsed by TradingView. Read more in the Terms of Use.