PDD Stock Trading Plan (2025-07-12)
Final Trading Decision
1. Comprehensive Summary of Each Model's Key Points
DS Report
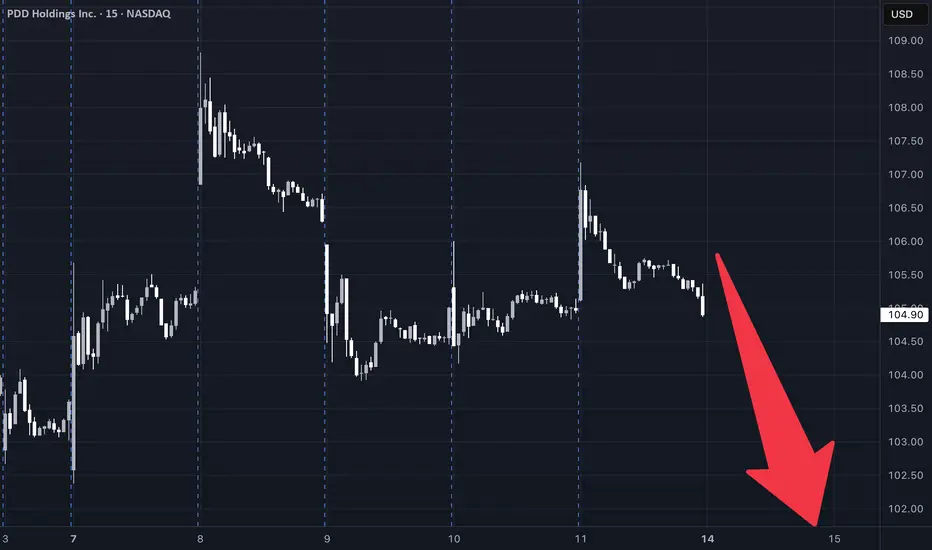
Technical Analysis: Price: Currently at $104.91, facing short-term bearish pressures with significant support at $104.83. Indicators: Short-term indicators (30-min) show bearish signals, while daily indicators hint at a potential bullish reversal (e.g., MACD bullish divergence). Sentiment: Mixed headlines with a stable VIX suggest a favorable but cautious entry environment. Trade Strategy: Long with a target of $108.70 and stop loss at $104.10 based on recent support levels.
LM Report
Technical Analysis: Price: Above the long-term bullish trend but facing near-term resistance. Indicators: Neutral RSI levels do not suggest a clear direction. MACD shows some signs of hesitance. Sentiment: Slightly bullish due to institutional flows and a falling VIX but lacks strong conviction. Trade Strategy: Suggests a long position at $105.50, with a profit target of $113.64.
GK Report
Technical Analysis: Describes a neutral situation with prices around key EMAs and exhibiting consolidation. Weak momentum signals indicate uncertainty regarding outright positions. Sentiment: Highlights mixed news with both bullish and bearish implications. Trade Strategy: Recommends not to trade due to the unclear directional bias.
CD Report
Technical Analysis: Confirms short-term bearish momentum with price below moving averages and mixed momentum indicators. Suggests a moderately bearish sentiment based on resistance levels. Sentiment: Slightly positive VIX implies stability; however, recent call volumes show mixed institutional sentiment. Trade Strategy: Strong short position recommended to profit from resistance at $105.70.
2. Areas of Agreement and Disagreement
Agreement:
Most models agree on near-term bearish indicators (e.g., weak momentum, mixed MACD signals across timeframes). Multiple reports note the importance of the $104.30-$106.20 price range as critical support/resistance.
Disagreement:
Long vs. Short Positions: DS and LM suggest potential long positions based on technical rebounds, while CD firmly recommends a short position anticipating downward movement. Market Sentiment: Some models see potential bullish opportunities in VIX stability and call volume, while others express caution due to mixed signals.
3. Conclusion and Recommendations
Overall Market Direction Consensus
The market is in a neutral to moderately bearish state based on the conflicting signals from the models. The current indicators do not suggest a strong bullish trend, while technical analysis indicates possible downward momentum.
Recommended Trade
Direction: Short Position Entry Price: $104.90 at market open. Stop Loss: $106.20 (1.2% loss). Take Profit: $102.50 (2.3% gain). Position Sizing: Based on a $10,000 account with a 2-3% risk tolerance, risking approximately $100-$120 total. Holding Period: 3-4 weeks maximum. Confidence Level: 65% based on resistance rejection and mixed sentiment.
Key Risks and Considerations
Risk of a market reversal if bullish news arrives or a strong institutional buying momentum occurs. Close monitoring of technical indicators is required, particularly the MACD and RSI, as conditions shift either direction could warrant position adjustments.
TRADE_DETAILS (JSON Format)
{ "instrument": "PDD", "direction": "short", "entry_price": 104.90, "stop_loss": 106.20, "take_profit": 102.50, "size": 200, "confidence": 0.65, "entry_timing": "open" }
📊 TRADE DETAILS 📊 🎯 Instrument: PDD 📉 Direction: SHORT 💰 Entry Price: 104.9 🛑 Stop Loss: 106.2 🎯 Take Profit: 102.5 📊 Size: 200 💪 Confidence: 65% ⏰ Entry Timing: open
Disclaimer: This newsletter is not trading or investment advice but for general informational purposes only. This newsletter represents my personal opinions based on proprietary research which I am sharing publicly as my personal blog. Futures, stocks, and options trading of any kind involves a lot of risk. No guarantee of any profit whatsoever is made. In fact, you may lose everything you have. So be very careful. I guarantee no profit whatsoever, You assume the entire cost and risk of any trading or investing activities you choose to undertake. You are solely responsible for making your own investment decisions. Owners/authors of this newsletter, its representatives, its principals, its moderators, and its members, are NOT registered as securities broker-dealers or investment advisors either with the U.S. Securities and Exchange Commission, CFTC, or with any other securities/regulatory authority. Consult with a registered investment advisor, broker-dealer, and/or financial advisor. By reading and using this newsletter or any of my publications, you are agreeing to these terms. Any screenshots used here are courtesy of TradingView. I am just an end user with no affiliations with them. Information and quotes shared in this blog can be 100% wrong. Markets are risky and can go to 0 at any time. Furthermore, you will not share or copy any content in this blog as it is the authors' IP. By reading this blog, you accept these terms of conditions and acknowledge I am sharing this blog as my personal trading journal, nothing more.
Final Trading Decision
1. Comprehensive Summary of Each Model's Key Points
DS Report
Technical Analysis: Price: Currently at $104.91, facing short-term bearish pressures with significant support at $104.83. Indicators: Short-term indicators (30-min) show bearish signals, while daily indicators hint at a potential bullish reversal (e.g., MACD bullish divergence). Sentiment: Mixed headlines with a stable VIX suggest a favorable but cautious entry environment. Trade Strategy: Long with a target of $108.70 and stop loss at $104.10 based on recent support levels.
LM Report
Technical Analysis: Price: Above the long-term bullish trend but facing near-term resistance. Indicators: Neutral RSI levels do not suggest a clear direction. MACD shows some signs of hesitance. Sentiment: Slightly bullish due to institutional flows and a falling VIX but lacks strong conviction. Trade Strategy: Suggests a long position at $105.50, with a profit target of $113.64.
GK Report
Technical Analysis: Describes a neutral situation with prices around key EMAs and exhibiting consolidation. Weak momentum signals indicate uncertainty regarding outright positions. Sentiment: Highlights mixed news with both bullish and bearish implications. Trade Strategy: Recommends not to trade due to the unclear directional bias.
CD Report
Technical Analysis: Confirms short-term bearish momentum with price below moving averages and mixed momentum indicators. Suggests a moderately bearish sentiment based on resistance levels. Sentiment: Slightly positive VIX implies stability; however, recent call volumes show mixed institutional sentiment. Trade Strategy: Strong short position recommended to profit from resistance at $105.70.
2. Areas of Agreement and Disagreement
Agreement:
Most models agree on near-term bearish indicators (e.g., weak momentum, mixed MACD signals across timeframes). Multiple reports note the importance of the $104.30-$106.20 price range as critical support/resistance.
Disagreement:
Long vs. Short Positions: DS and LM suggest potential long positions based on technical rebounds, while CD firmly recommends a short position anticipating downward movement. Market Sentiment: Some models see potential bullish opportunities in VIX stability and call volume, while others express caution due to mixed signals.
3. Conclusion and Recommendations
Overall Market Direction Consensus
The market is in a neutral to moderately bearish state based on the conflicting signals from the models. The current indicators do not suggest a strong bullish trend, while technical analysis indicates possible downward momentum.
Recommended Trade
Direction: Short Position Entry Price: $104.90 at market open. Stop Loss: $106.20 (1.2% loss). Take Profit: $102.50 (2.3% gain). Position Sizing: Based on a $10,000 account with a 2-3% risk tolerance, risking approximately $100-$120 total. Holding Period: 3-4 weeks maximum. Confidence Level: 65% based on resistance rejection and mixed sentiment.
Key Risks and Considerations
Risk of a market reversal if bullish news arrives or a strong institutional buying momentum occurs. Close monitoring of technical indicators is required, particularly the MACD and RSI, as conditions shift either direction could warrant position adjustments.
TRADE_DETAILS (JSON Format)
{ "instrument": "PDD", "direction": "short", "entry_price": 104.90, "stop_loss": 106.20, "take_profit": 102.50, "size": 200, "confidence": 0.65, "entry_timing": "open" }
📊 TRADE DETAILS 📊 🎯 Instrument: PDD 📉 Direction: SHORT 💰 Entry Price: 104.9 🛑 Stop Loss: 106.2 🎯 Take Profit: 102.5 📊 Size: 200 💪 Confidence: 65% ⏰ Entry Timing: open
Disclaimer: This newsletter is not trading or investment advice but for general informational purposes only. This newsletter represents my personal opinions based on proprietary research which I am sharing publicly as my personal blog. Futures, stocks, and options trading of any kind involves a lot of risk. No guarantee of any profit whatsoever is made. In fact, you may lose everything you have. So be very careful. I guarantee no profit whatsoever, You assume the entire cost and risk of any trading or investing activities you choose to undertake. You are solely responsible for making your own investment decisions. Owners/authors of this newsletter, its representatives, its principals, its moderators, and its members, are NOT registered as securities broker-dealers or investment advisors either with the U.S. Securities and Exchange Commission, CFTC, or with any other securities/regulatory authority. Consult with a registered investment advisor, broker-dealer, and/or financial advisor. By reading and using this newsletter or any of my publications, you are agreeing to these terms. Any screenshots used here are courtesy of TradingView. I am just an end user with no affiliations with them. Information and quotes shared in this blog can be 100% wrong. Markets are risky and can go to 0 at any time. Furthermore, you will not share or copy any content in this blog as it is the authors' IP. By reading this blog, you accept these terms of conditions and acknowledge I am sharing this blog as my personal trading journal, nothing more.
Free Signals Based on Latest AI models💰: QuantSignals.xyz
Related publications
Disclaimer
The information and publications are not meant to be, and do not constitute, financial, investment, trading, or other types of advice or recommendations supplied or endorsed by TradingView. Read more in the Terms of Use.