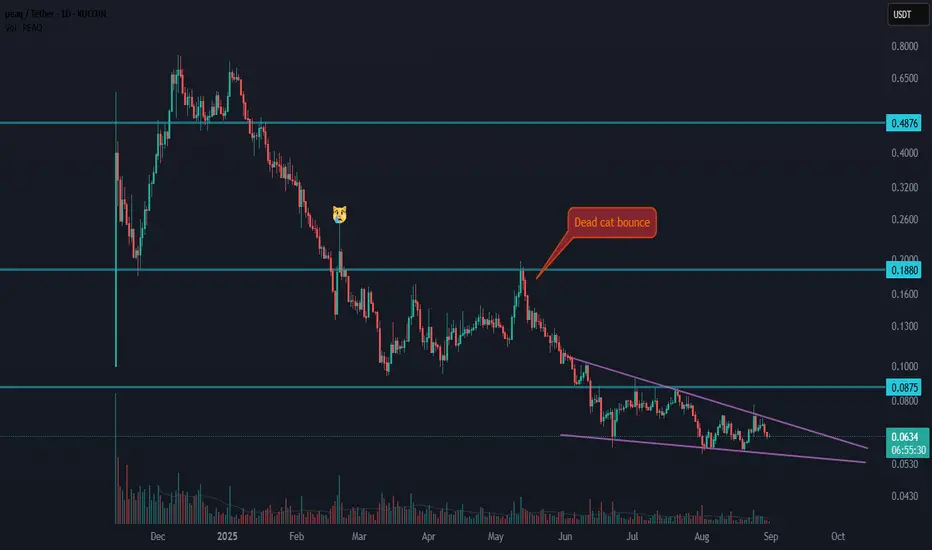
🔄 Update: In the previous setup, price made a dead cat bounce with a fake breakout, and continued its downside move.
Now, the chart has formed a falling wedge, which is considered a strong bullish pattern.
A breakout above the wedge’s resistance could be a solid trigger.
✅ Confirmation of trend reversal will be at 0.0875 in MWC (Medium Wave Cycle) and at 0.1880 in HWC (High Wave Cycle).
⚠️ Please remember: using this analysis requires strict risk management and capital management.
What’s your view on $PEAQ? 👇
Disclaimer
The information and publications are not meant to be, and do not constitute, financial, investment, trading, or other types of advice or recommendations supplied or endorsed by TradingView. Read more in the Terms of Use.
Disclaimer
The information and publications are not meant to be, and do not constitute, financial, investment, trading, or other types of advice or recommendations supplied or endorsed by TradingView. Read more in the Terms of Use.