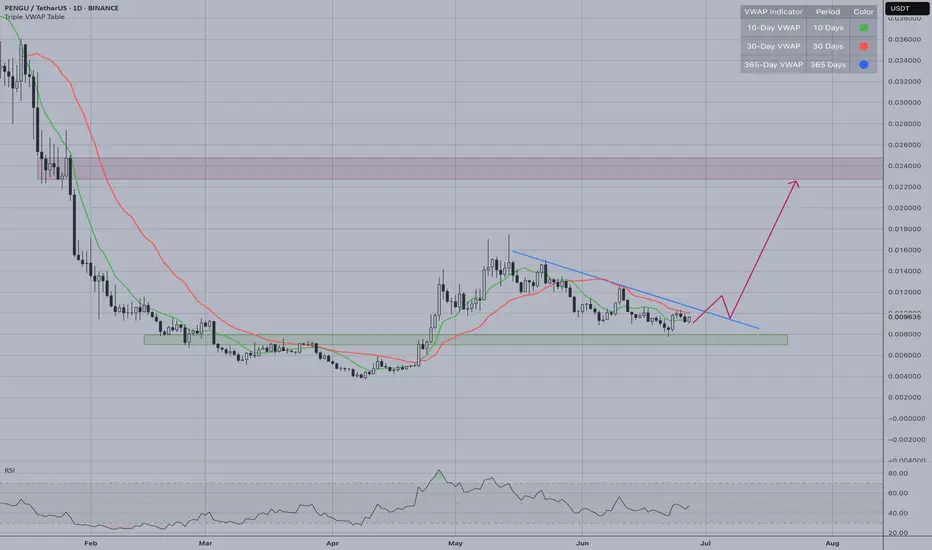
PENGU/USDT is forming a classic descending triangle pattern with price consolidating near the lower support zone around 0.0060-0.0080. The key resistance level is the descending trendline (blue line) that has been capping recent rallies. RSI shows recovery from oversold conditions, suggesting selling pressure may be exhausting.
A decisive break above the trendline would signal a shift in momentum and potentially trigger the bullish scenario outlined by the red arrow projection. This breakout could target the upper resistance zone around 0.0220, representing significant upside potential.
The current consolidation near support provides a favorable risk-to-reward setup for patient traders. However, failure to break the trendline could see price retest the lower support levels. Volume confirmation on any breakout attempt will be crucial for validating the bullish thesis. Risk should be managed with stops below the recent lows around 0.0050.
Find top crypto tokens with sector indices, AI-powered sentiment analysis & news summaries.
tokenradar.ai/tv
tokenradar.ai/tv
Disclaimer
The information and publications are not meant to be, and do not constitute, financial, investment, trading, or other types of advice or recommendations supplied or endorsed by TradingView. Read more in the Terms of Use.