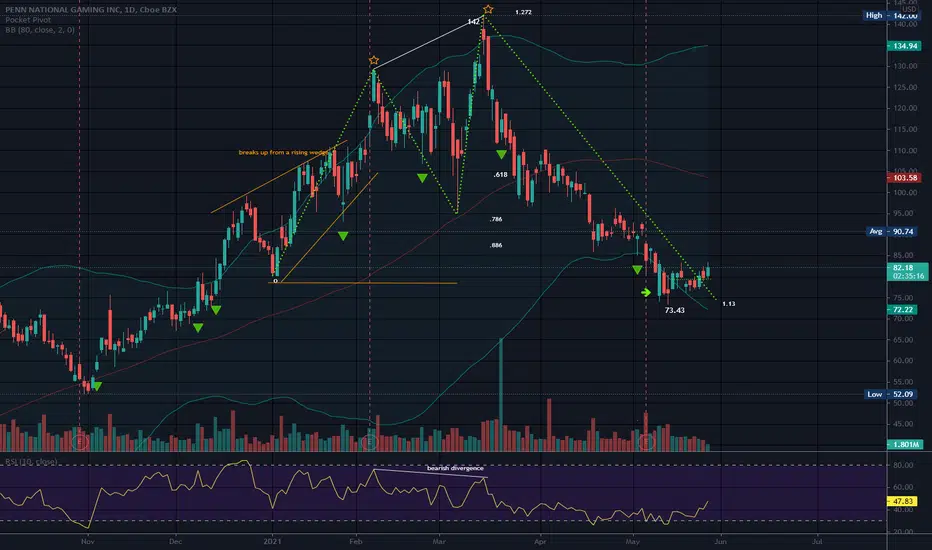
PENN had quite a run the first go around. Bearish divergence on RSI at the two tops. I would imagine this has corrected by now (o:
A bearish divergence, especially after a long run to the upside, can warn you to be careful about buying the dip. The RSI or another oscillator does not agree with price movement.
Often a chart signal that warns you not to buy can be just as useful as one that warns you it’s time to sell. Bearish divergences don’t necessarily suggest investors should sell right that second, but they do warn that when a breakdown in price does occur, they should consider getting out of the security in question. Divergences often do not affect price immediately and can take time to show up. Some folks verify the divergence in the weekly timeframe.
From the quick fib levels I did, peak 2 is above peak 1 and peak 2 almost hit the 1.272 fib level. The 2nd leg pulled back between the .618 and .786 fib levels. The low of the final leg is just below the 1.13 fib level. I did not go deeply in to identifying this pattern, but it appears to be a shark. Since peak 2 is above peak 1, many harmonic patterns are ruled out. That narrows it down to perhaps being a shark, because the cypher only pulls back to the .786 and this pulled just about to the 1.13. This can be subjective as it depends on where you place your 1st leg at.
As for moving averages, the 50 DMA has crossed down through the 100 DMA (bearish to many) but not the 200 DMA. Price is under all 3 long term moving averages today. The longest term moving average of this set is sloping up (200). The 50 is sloping down and the 100 appears flat. Price is also just below the 20. Moving averages can provide support and resistance, so some may place a stop under a certain moving average like the 200, of course price would need to be above that moving average if you are long (o: Some trade using different moving average crossovers depending on the timeframe they trade. I and a pattern trader and we are all different, but I do take a look at moving averages and volume to confirm. I like to buy very close to some form of support and I do not mind bottom fishing or deep pull back fishing, but if you do this, often the moving averages do not look so hot, but as a rule securities eventually recover as long as the market is bullish. Some will only buy if all the moving averages are in line where they are supposed to be and that is a good practice, but eliminates bottom fishing as a rule. This one has not been dwelling on the bottom too long at this point and does seem to have slowed from the fall to form a horizontal trading zone. But it is risky to try and peg bottoms and this one definitely needs some moving average improvement.
PENN broke up and out of a rising wedge. I owned it when this happened, and sold it at the first peak. I guess I screwed up, lol. Don't you hate it when you sell to soon? I made a nice profit, and I suppose it is better to get out with a profit than a loss )o: Rising wedges are bearish, but I have seen several break up and out of a bearish rising wedge since the manmade flu bottom. I have been watching this one and waiting until it cleared the 1st rising wedge as there are multiple in this chart. I only drew the lowest one to avoid chart overload. Both trendlines slope up and converge at the apex. Often a security will find support from a level within the wedge, and other times they fall to a parallel level to the bottom of the trendline of the wedge, and can fall even further.
Price pulled below the bottom trendline of the bollinger bands with the moving average set on 80. This is bearish to many, but price usually goes back inside the bands in a timely manner.
When a security pulls back, there is always that chance it is a trend change)o:
No recommendation
Note
There are folks stuck overhead who bought at higher prices who will sell every chance they get when price moves up and this can make buying bottoms or pullbacks even more difficultDisclaimer
The information and publications are not meant to be, and do not constitute, financial, investment, trading, or other types of advice or recommendations supplied or endorsed by TradingView. Read more in the Terms of Use.
Disclaimer
The information and publications are not meant to be, and do not constitute, financial, investment, trading, or other types of advice or recommendations supplied or endorsed by TradingView. Read more in the Terms of Use.