hi Traders,
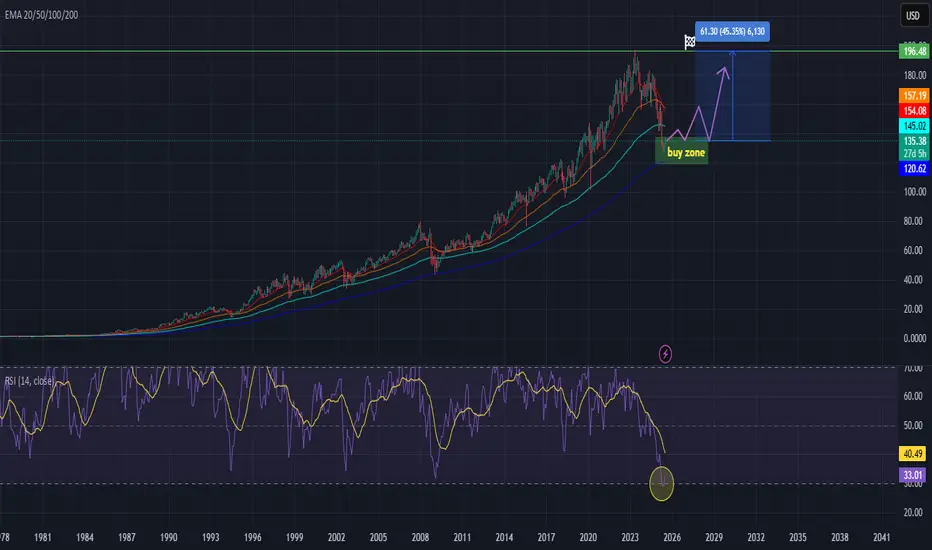
The chart presents a compelling long-term buying opportunity for PepsiCo (PEP). The price is currently sitting in the identified "buy zone", a historically reliable area for accumulation. If we experience further dips, it’s still considered a buying opportunity all the way down to the 200 EMA, which currently sits at $120.62.
Historically, every time PEP’s price approached or touched the 200 EMA on the monthly time frame, it marked a major bottom and a strong reversal point. We believe this time is no different—the long-term trend remains intact and the fundamentals continue to support value.
Additionally, the RSI has reached oversold conditions on the monthly chart, which is rare for this stock and signals a potential undervaluation. Oversold RSI levels have consistently aligned with excellent long-term entry points.
Our target is the previous all-time high (ATH) of $196.48, with expectations to break beyond it as the recovery unfolds. This setup offers a favorable risk-to-reward ratio for long-term investors and swing traders alike.
Summary:
✅ Price in the buy zone
✅ Buying opportunity down to the 200 EMA ($120.62)
✅ Monthly RSI in oversold = undervaluation signal
🎯 Target: Previous ATH and beyond ($196.48+)
Long-term bulls, this is your moment.
Do you agree? Leave your comments!
💥 Free signals and ideas ➡ t.me/vfinvestment
Disclaimer
The information and publications are not meant to be, and do not constitute, financial, investment, trading, or other types of advice or recommendations supplied or endorsed by TradingView. Read more in the Terms of Use.
💥 Free signals and ideas ➡ t.me/vfinvestment
Disclaimer
The information and publications are not meant to be, and do not constitute, financial, investment, trading, or other types of advice or recommendations supplied or endorsed by TradingView. Read more in the Terms of Use.