PEPE shows a head and shoulder breakdown.
Bullish RSI divergence fails; PEPE drops 38% in 10 days.
78% of PEPE holders are in the red.
Price drops 22% in 24 hours to $0.0000008432.
PEPE currently trades at $0.0000008672, with a 6.93% intraday loss.
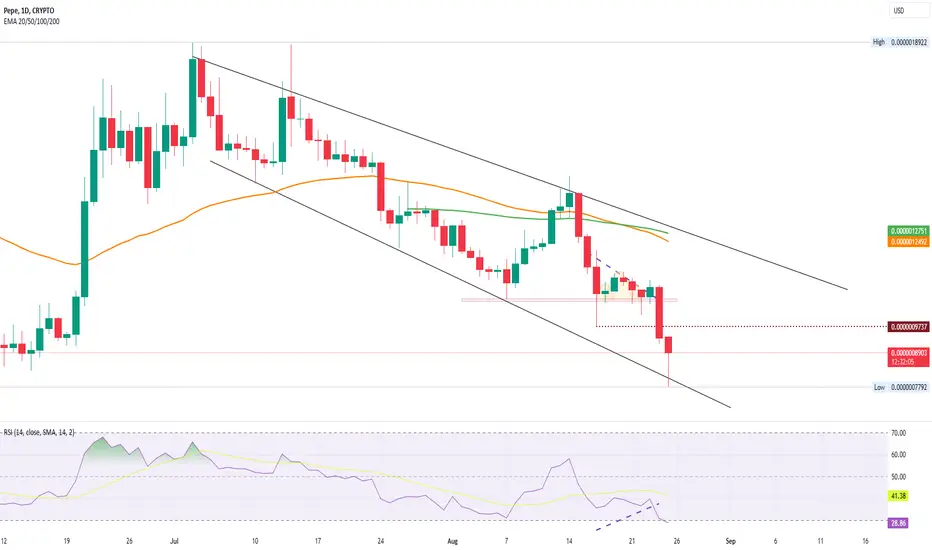
Falling wedge pattern observed in the 1-day chart.
PEPE may trend sideways between $0.0000008432 and $0.0000010.
A breach below support could push PEPE to $0.0000006721.
Bullish RSI divergence fails; PEPE drops 38% in 10 days.
78% of PEPE holders are in the red.
Price drops 22% in 24 hours to $0.0000008432.
PEPE currently trades at $0.0000008672, with a 6.93% intraday loss.
Falling wedge pattern observed in the 1-day chart.
PEPE may trend sideways between $0.0000008432 and $0.0000010.
A breach below support could push PEPE to $0.0000006721.
Disclaimer
The information and publications are not meant to be, and do not constitute, financial, investment, trading, or other types of advice or recommendations supplied or endorsed by TradingView. Read more in the Terms of Use.
Disclaimer
The information and publications are not meant to be, and do not constitute, financial, investment, trading, or other types of advice or recommendations supplied or endorsed by TradingView. Read more in the Terms of Use.