Recent closing prices for PEPE have shown variability, hovering around the $0.00001213 to $0.00001261 range. This indicates a phase of consolidation as traders await clearer market direction. The crucial resistance levels to watch are at $0.00001281, $0.00001293, and $0.00001297. A decisive break above these levels could signal a bullish momentum, potentially driving the price higher.
On the downside, immediate support is observed at $0.00001220, with stronger support levels at $0.00001211 and $0.00001199. Should the price dip below these supports, it might indicate a bearish trend, encouraging traders to consider short positions.
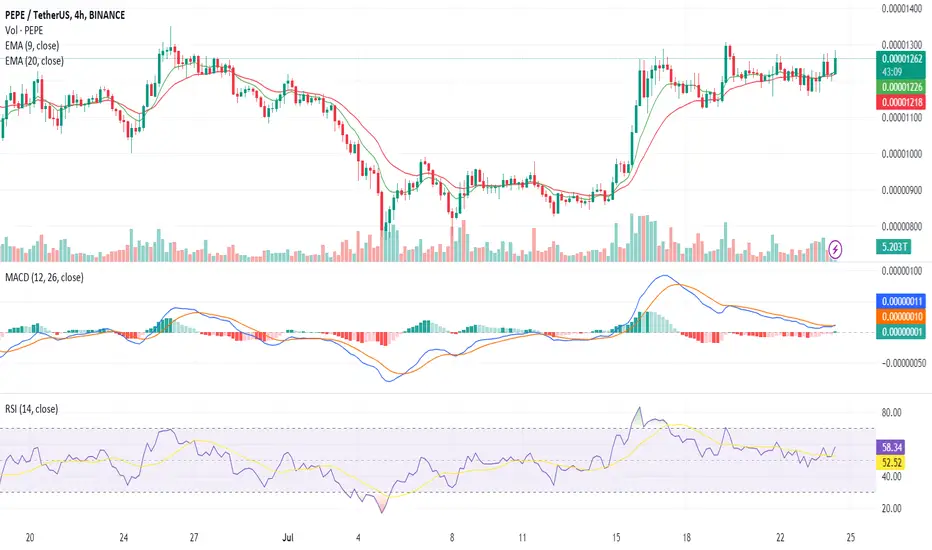
The 9 and 20 Exponential Moving Averages (EMAs) highlight a subtle bullish crossover, with the 9 EMA trending slightly above the 20 EMA. This crossover often suggests upward momentum, yet the proximity of these EMAs indicates the potential for sideways movement unless a more pronounced divergence occurs.
Meanwhile, the Moving Average Convergence Divergence (MACD) indicator presents a mixed picture. Initially, the MACD line was below the signal line, hinting at bearish sentiment. However, a recent crossover to positive histogram values suggests a potential shift towards bullish momentum. Traders should monitor this closely for confirmation of sustained bullish trends.
The Relative Strength Index (RSI) has oscillated between 52 and 58, reflecting a neutral to slightly bullish sentiment. An RSI above 50 typically indicates buying pressure, yet the lack of extreme values suggests the market is not overbought or oversold.
For traders looking to enter long positions, a breakout above the resistance at $0.00001281 could serve as a potential entry point, targeting subsequent resistances at $0.00001293 and $0.00001297. Conversely, if the price breaches the support at $0.00001220, short positions could be considered, with targets at $0.00001211 and $0.00001199.
It's essential to place stop-loss orders to mitigate risk, ideally below the next support level for long trades and above the next resistance level for short trades.
In conclusion, the Pepe crypto price on the 4-hour chart indicates a phase of consolidation with potential for both bullish and bearish moves, depending on market dynamics. Traders should closely monitor key support and resistance levels alongside technical indicators for informed decision-making.
Disclaimer
The information and publications are not meant to be, and do not constitute, financial, investment, trading, or other types of advice or recommendations supplied or endorsed by TradingView. Read more in the Terms of Use.
Disclaimer
The information and publications are not meant to be, and do not constitute, financial, investment, trading, or other types of advice or recommendations supplied or endorsed by TradingView. Read more in the Terms of Use.