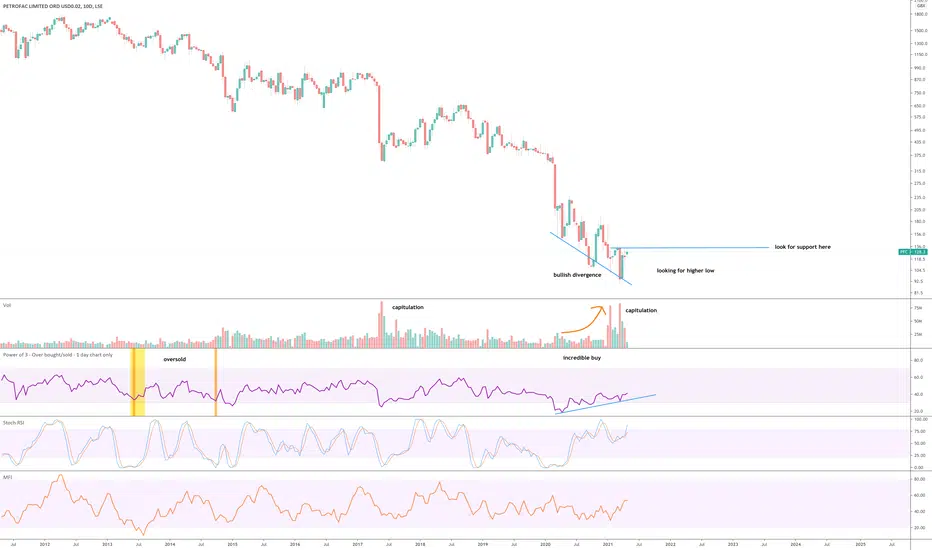
A 92% correction from July 2012 (ouch) creating a considerable oversold condition (as if it was not already obvious) there now exists an ‘incredible buy opportunity’ for those brave enough.
Why Bullish?
1) The bears are exhausted - this is indicated by the ‘capitulation’ volume candles. Remember, ‘Extremes in a market is marked by extremes in volume’.
2) Regular bullish divergence between price action and the oscillators is clearly visible on the above 10-day chart.
3) Volume increase + point (2) = very bullish.
4) The most bullish signal of all appears on the 2-month chart below, a Dragonfly DOJI. Those candles are not to be ignored. The further up the time scale the more powerful the signal. Weekly DOJI’s are great, monthly better. 2-month candles are on another level.
2-month chart
Trade active
9 oscillators showing divergence with price action, price action is ready to pop.Trade active
30% up two hours later, which one of you was it? Fess up... 1st target 195
Trade active
up 40% 140 days later. Bazinga!BTC
bc1q2eckdzh0q8vsd7swcc8et6ze7s99khhxyl7zwy
Weblink: patreon.com/withoutworries
Allow 3-6 months on ideas. Not investment advice. DYOR
bc1q2eckdzh0q8vsd7swcc8et6ze7s99khhxyl7zwy
Weblink: patreon.com/withoutworries
Allow 3-6 months on ideas. Not investment advice. DYOR
Disclaimer
The information and publications are not meant to be, and do not constitute, financial, investment, trading, or other types of advice or recommendations supplied or endorsed by TradingView. Read more in the Terms of Use.
BTC
bc1q2eckdzh0q8vsd7swcc8et6ze7s99khhxyl7zwy
Weblink: patreon.com/withoutworries
Allow 3-6 months on ideas. Not investment advice. DYOR
bc1q2eckdzh0q8vsd7swcc8et6ze7s99khhxyl7zwy
Weblink: patreon.com/withoutworries
Allow 3-6 months on ideas. Not investment advice. DYOR
Disclaimer
The information and publications are not meant to be, and do not constitute, financial, investment, trading, or other types of advice or recommendations supplied or endorsed by TradingView. Read more in the Terms of Use.