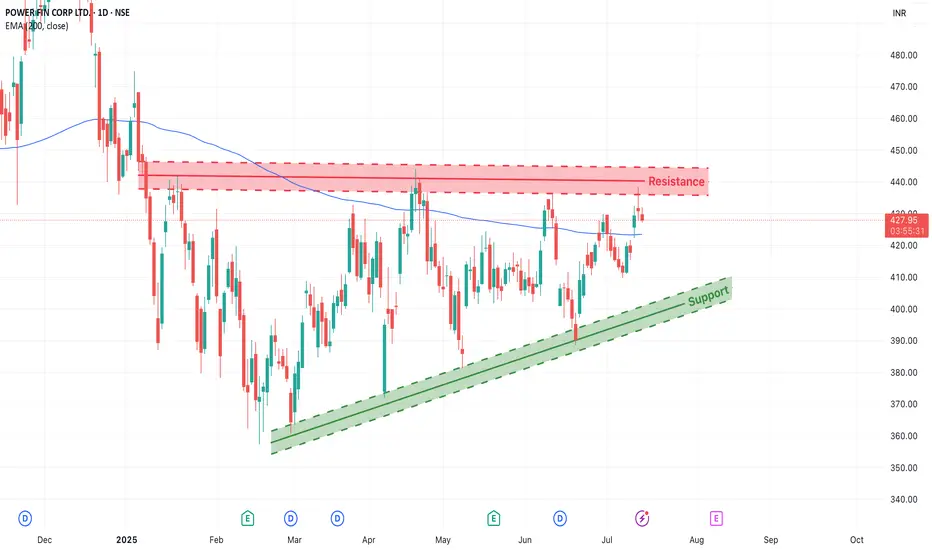
Power Finance Corporation (NSE: PFC) is forming a technically clean structure — trading within a rising trend channel and now testing a critical resistance zone around ₹430–₹440.
This is a make-or-break level, and the market could tip in either direction depending on how price reacts this week.
1. Chart Structure Overview
2. Two Trade Scenarios
Scenario 1: Bullish Breakout (Trend Continuation)
🔁 Risk/Reward: 1:2 or better
Scenario 2: Resistance Rejection (Short-Term Pullback)
🔁 Risk/Reward: 1:2 to 1:3 depending on entry
Thread>
This is a make-or-break level, and the market could tip in either direction depending on how price reacts this week.
1. Chart Structure Overview
- Support Zone: Defined by a rising green trendline connecting higher lows since March 2025.
- Resistance Zone: Red band between ₹430–₹440, where price has previously reversed multiple times.
- 200 EMA (Blue Line): Currently hovering around ₹423, adding confluence as a dynamic support/resistance level.
- This convergence makes the current price zone crucial for directional confirmation.
2. Two Trade Scenarios
Scenario 1: Bullish Breakout (Trend Continuation)
- If the price breaks above ₹440 with strong bullish candles, traders can look for:
- ✅ Entry after a confirmed breakout + re-test of the ₹430–₹435 zone
- 🎯 Target Zones: ₹455, ₹470+
- 🛡️ Stop Loss: Below the swing low of the re-test (₹425 or as per price structure)
🔁 Risk/Reward: 1:2 or better
Scenario 2: Resistance Rejection (Short-Term Pullback)
- If the price fails to break above ₹430–₹440 and shows reversal patterns:
- ✅ Entry on confirmation (e.g., bearish engulfing, rejection wick)
- 🎯 Target Zones: ₹410 (near rising trendline), possible extension to ₹400
- 🛡️ Stop Loss: Just above the resistance (~₹442–₹445)
🔁 Risk/Reward: 1:2 to 1:3 depending on entry
Thread>
Note
14/07/2025 - Market Update- On 15 Minute Timeframe, It's showing head and should pattern
- Strong rejection from resistance level
- Currently trading near neckline of pattern
- Breakdown leads strong downside rally
- Can enter at breakdown level or wait to re-test
Note
Trade Updates:- Given neckline break of Head and Should pattern
- Breakout entry or wait for re-test
*Waiting for pull back upto break level
Note
- As expected PFC Given a good pullback towards the head and shoulder Neckline- Wait for Bearish candle near neckline for pullback entry
Trade active
15/07/2025 - Market Update-As expected give good re-tracement upto the break level.
- Evening start candlestick pattern occured at resistance level
- Focusing Short position for 1:2, 1:4+ , 1.6+ Target
📈 Trade Smarter with TradZoo!
📣 Telegram: t.me/tradzooIndex
📣 Forex Telegram: t.me/tradzoofx
📲 Mobile App: tradzoo.com/download
📲 Forex App:tradzoo.com/forex/download
🔗 Website: bit.ly/tradzoopage
📣 Telegram: t.me/tradzooIndex
📣 Forex Telegram: t.me/tradzoofx
📲 Mobile App: tradzoo.com/download
📲 Forex App:tradzoo.com/forex/download
🔗 Website: bit.ly/tradzoopage
Related publications
Disclaimer
The information and publications are not meant to be, and do not constitute, financial, investment, trading, or other types of advice or recommendations supplied or endorsed by TradingView. Read more in the Terms of Use.