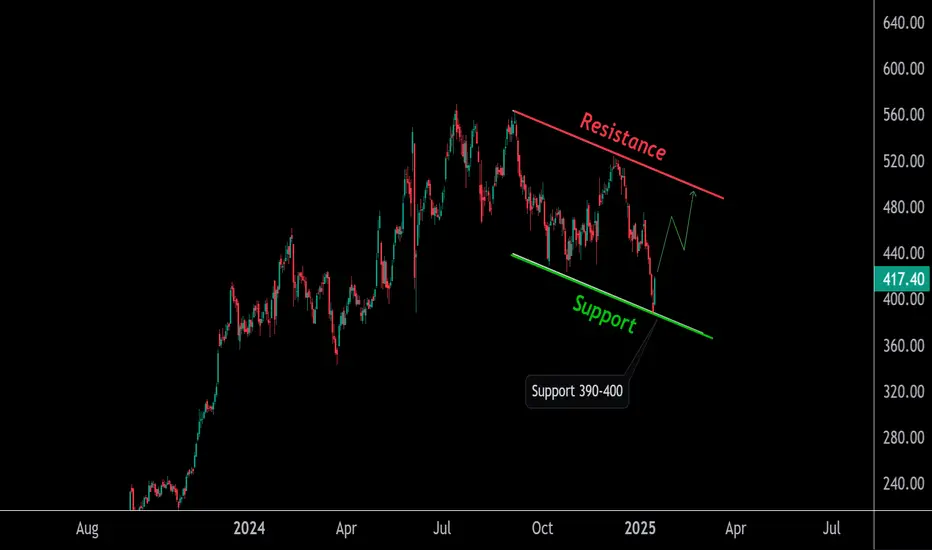
This is the daily timeframe chart of PFC
Prices are down 30% from highs and now currently trading around 400 levels
Stock is making flag pattern and we may get huge upside if stock gives breakout of the resistance
One can expect stock to gp up till 480-490 levels for quick upside
Thank You !!
Prices are down 30% from highs and now currently trading around 400 levels
Stock is making flag pattern and we may get huge upside if stock gives breakout of the resistance
One can expect stock to gp up till 480-490 levels for quick upside
Thank You !!
@RahulSaraoge
Connect us at t.me/Fivecirclesofficial
Connect us at t.me/Fivecirclesofficial
Disclaimer
The information and publications are not meant to be, and do not constitute, financial, investment, trading, or other types of advice or recommendations supplied or endorsed by TradingView. Read more in the Terms of Use.