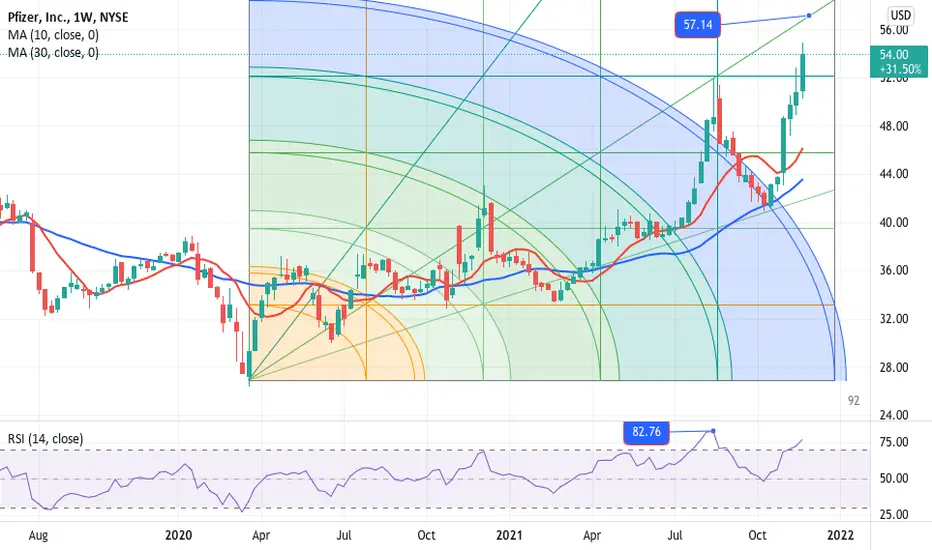
The daily and weekly chart are starting to suggest a peak in the near future.
The RSI weekly and Daily chart are getting overbought, not extreme, but good enough to becareful.
Strategy sell near $ 57 for a buy-back $ 40.
Stop-loss likely somewhere $ 59
The RSI weekly and Daily chart are getting overbought, not extreme, but good enough to becareful.
Strategy sell near $ 57 for a buy-back $ 40.
Stop-loss likely somewhere $ 59
Disclaimer
The information and publications are not meant to be, and do not constitute, financial, investment, trading, or other types of advice or recommendations supplied or endorsed by TradingView. Read more in the Terms of Use.
Disclaimer
The information and publications are not meant to be, and do not constitute, financial, investment, trading, or other types of advice or recommendations supplied or endorsed by TradingView. Read more in the Terms of Use.