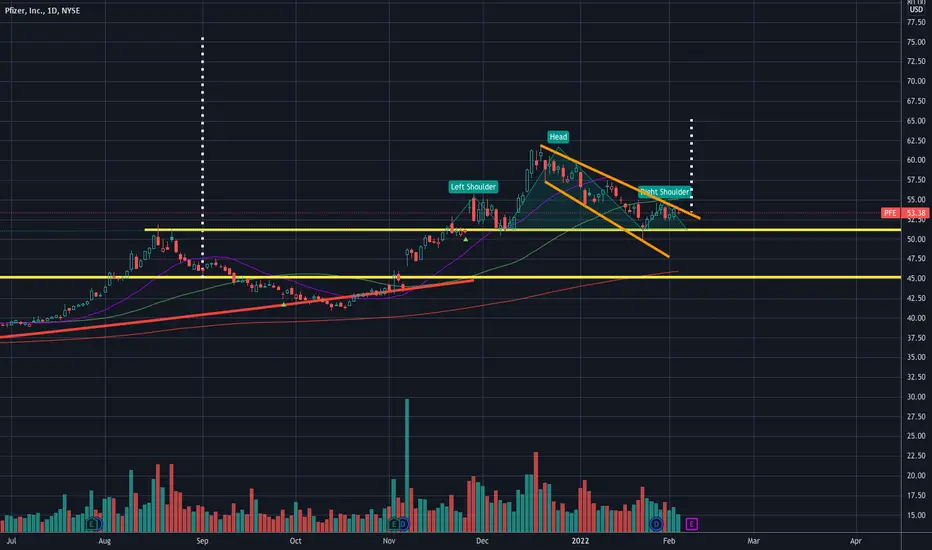
Looking like the stock might be in the process of breaking out of that Broadening wedge. Although there is a possibility of head and shoulder completion, I am not sure it will play out.
However, there is earning coming up on Feb 8 that could decide which pattern will play out.
Here is how I see it. If the price breaks above $55, the bullish case will play out and price could reach $64.
But if the price breaks below $50 and more importantly $49, the bearish case will play out with potential fall to $45.
But I am leaning bullish case.
Bullish target 1 - $56
Bullish target 2 - $64
Risk - the price breaks down to $45 and fill the gap.
———————————————————
How to read my charts?
- Matching color trend lines shows the pattern. Sometimes a chart can have multiple patterns. Each pattern will have matching color trend lines.
- The yellow horizontal lines shows support and resistance areas.
- Fib lines also shows support and resistance areas.
- The dotted white lines shows price projection for breakout or breakdown target.
Disclaimer: Do your own DD. Not an investment advice.
I am not a licensed professional. None of the posts that I published are investment advice. Do your own research.
Disclaimer
The information and publications are not meant to be, and do not constitute, financial, investment, trading, or other types of advice or recommendations supplied or endorsed by TradingView. Read more in the Terms of Use.