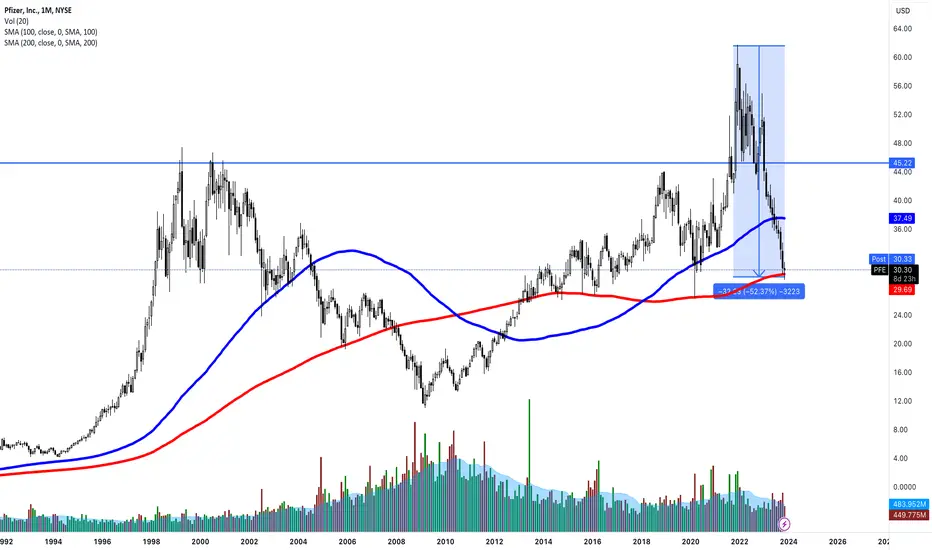
After a 52%+ pull back in the last year, you can look at this chart and pretty easily determine your best case scenario and your worst case. A LOT of selling months in a row, leading up to a doji so far in Nov...
Disclaimer
The information and publications are not meant to be, and do not constitute, financial, investment, trading, or other types of advice or recommendations supplied or endorsed by TradingView. Read more in the Terms of Use.
Disclaimer
The information and publications are not meant to be, and do not constitute, financial, investment, trading, or other types of advice or recommendations supplied or endorsed by TradingView. Read more in the Terms of Use.