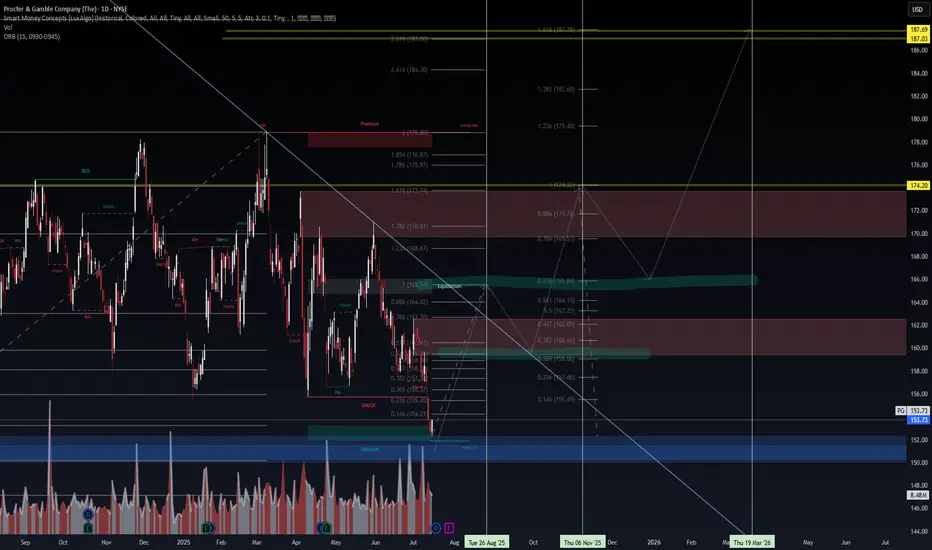
📝 Procter & Gamble (NYSE: PG) is trading at $153.73 (-10.8% YTD), lagging the S&P 500’s +6.5% YTD gain. Despite recent weakness, a confluence of technical support, dividend resilience, and a looming catalyst could signal a tactical entry. Let’s break it down:
🔍 Fundamentals & Catalysts
Q4 Earnings Webcast (July 29):
P&G will webcast Q4 results at 8:30 AM ET, with focus on organic sales growth (guided at +2% FY25) and margin trajectory 14.
EPS Expectations: Q4 consensus at $1.43 (+2.1% YoY); FY25 core EPS guided at $6.72–6.82 (2–4% growth) 410.
Dividend Fortress:
Quarterly payout raised to $1.0568/share (ex-div: July 18), marking 69 consecutive years of increases and a 2.75% yield 612.
Payout ratio at 67% of earnings – sustainable for a consumer staple 6.
Cost Pressures & Mitigation:
Tariff Headwinds: $1B–$1.5B annual cost hit from U.S.-China tariffs 410.
Offsets: $2.4B dividend payouts + $1.4B buybacks in Q3; 280bps gross productivity savings 10.
🌍 Macro & Risk Factors
Consumer Softness: Q3 net sales fell -2% YoY; volume declines in Baby Care (-2%) and Fabric & Home Care (-1%) segments 10.
Pricing Power: Average +1% pricing in Q3 (led by Grooming/Health Care), though mix/elasticity risks persist 104.
Structural Shifts: Portfolio pruning (minor brand exits) and job cuts to offset tariff impacts 4.
📉 Technical Setup: Oversold with Base-Building Potential
RSI 31.5 (Neutral but nearing oversold) 511.
Price vs. MAs: Below all key MAs (20-day: $159.17, 50-day: $161.59, 200-day: $165.56) – signaling bearish momentum but extreme discounts 5811.
Support Zone: $152–153 aligns with 52-week lows ($151.90) and the 2025 dividend-capture floor 212.
MACD -1.57: Suggests potential reversal if momentum shifts 5.
Technical Indicators Summary:
Indicator Value Signal
RSI (14) 31.45 Neutral
MACD (12,26) -1.57 Buy
Price vs. 200D SMA -7.1% Sell
Bollinger Bands (25) $157–161.94 Sell
🎯 Probabilistic Price Targets
Scenario Target Probability Rationale
Bounce to 20D MA $158–160 60% Mean reversion + dividend ex-date support
Reversion to 50D MA $162–164 45% Technical confluence + tariff resolution hopes
Rally to 200D MA + ATH $174 25% Bull case: Macro stabilization + guidance upgrade
📌 Trade Strategy
Entry: $152–154 (aligns with structural support) 28.
Stop Loss: $149.50 (1–2% below July 16 low of $152.27) 2.
Targets: Scale out at $160 → $164 → $174.
Catalysts: Q4 earnings (July 29) + clarity on tariff mitigation 14.
Position Size: Allocate 3–5% of portfolio; pair with long-volatility hedge.
⚠️ Key Risks
Guidance Miss: Sluggish volumes or tariff escalation could pressure FY26 EPS projections.
Technical Breakdown: Close below $151.90 invalidates support, inviting a slide to $145.
Macro Sensitivity: Consumer staples underperformance if inflation rebounds.
💎 Final Take
PG offers a rare combo: defensive yield (2.75%) + oversold technicals + imminent catalyst. While tariffs and consumer weakness justify caution, the $152–154 zone is a high-probability dip-buying opportunity. Earnings day vol could amplify moves – enter pre-event with tight stops.
#PG #ConsumerStaples #DividendKing #EarningsPlay #Tariffs
Disclaimer: This is not financial advice. Conduct your own due diligence.
Disclaimer
The information and publications are not meant to be, and do not constitute, financial, investment, trading, or other types of advice or recommendations supplied or endorsed by TradingView. Read more in the Terms of Use.
Disclaimer
The information and publications are not meant to be, and do not constitute, financial, investment, trading, or other types of advice or recommendations supplied or endorsed by TradingView. Read more in the Terms of Use.