Paragon Globe Berhad
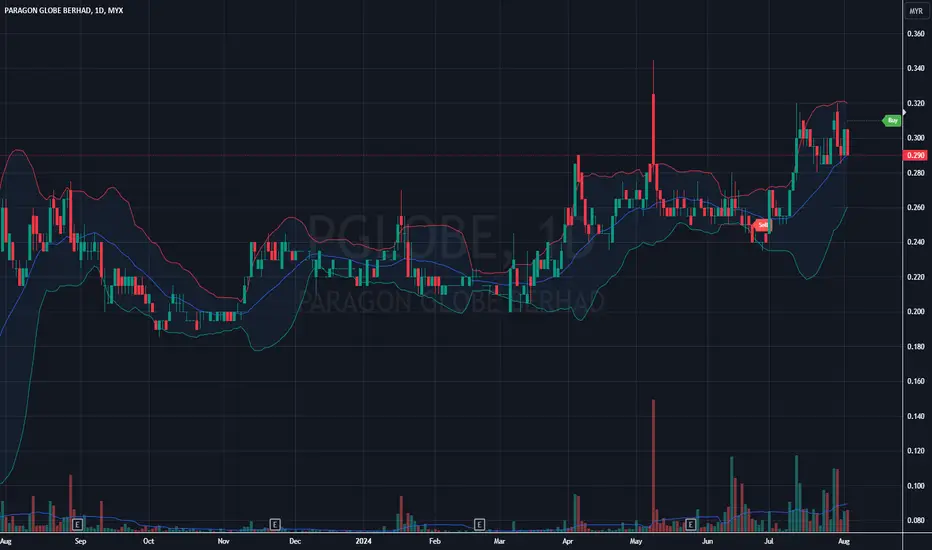
Overall, the technical picture appears bullish, but the stock may be approaching overbought levels in the short term. Traders might look for pullbacks to support levels for potential entry points.
- Trend: The overall trend appears bullish, with the price moving from around 0.160 in June 2023 to current levels around 0.290.
- Support and Resistance:
Key support levels seem to be around 0.240-0.250.
Resistance appears to be around 0.320-0.340. - Moving Averages: Two moving averages are visible (likely short-term and long-term). The price is currently above both, indicating bullish momentum.
- Volume: There are sporadic volume spikes, with recent increased activity, suggesting growing interest in the stock.
- Price Action:
Strong upward move from June to August 2023.
Consolidation from September 2023 to February 2024.
Another upward trend from March 2024 onwards, with increased volatility. - Recent Performance: The stock has shown significant strength in the past few months, with a sharp rise in May-June 2024.
- Volatility: Increased volatility is evident in recent months, with larger candlesticks and price swings.
- Indicators: The chart includes what appears to be a Bollinger Band indicator, showing periods of expansion and contraction that align with price movements.
Overall, the technical picture appears bullish, but the stock may be approaching overbought levels in the short term. Traders might look for pullbacks to support levels for potential entry points.
Trade closed: target reached
➀➁➂➃➄
Disclaimer
The information and publications are not meant to be, and do not constitute, financial, investment, trading, or other types of advice or recommendations supplied or endorsed by TradingView. Read more in the Terms of Use.
➀➁➂➃➄
Disclaimer
The information and publications are not meant to be, and do not constitute, financial, investment, trading, or other types of advice or recommendations supplied or endorsed by TradingView. Read more in the Terms of Use.