My trading plan is very simple.
I buy or sell when at three of these events happen:
* Price tags the top or bottom of parallel channel zones
* Money flow spikes beyond it's Bollinger Bands
* Stochastic Momentum Index (SMI) at near oversold overbought level
* Price at Fibonacci levels
So...
Here's why I'm picking this symbol to do the thing.
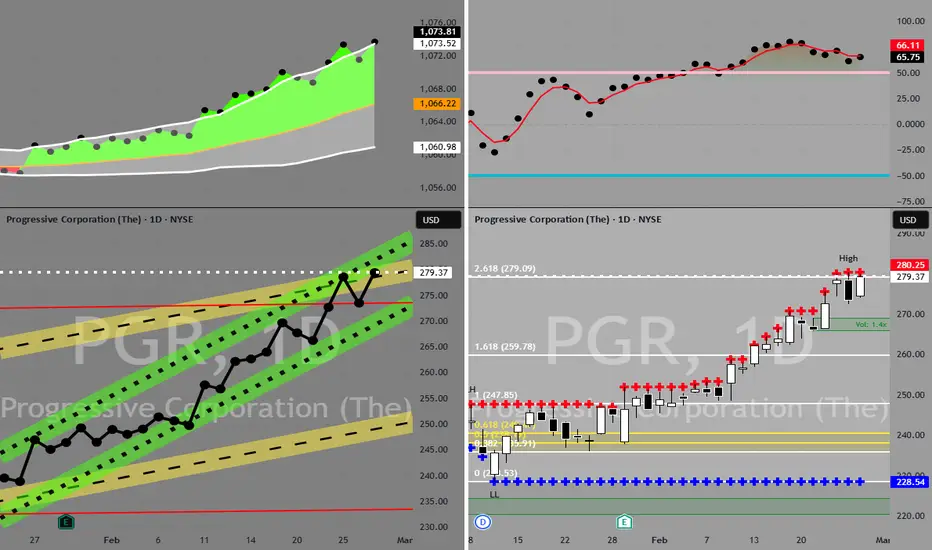
Price in selling zone at top of channels
[Red Line 100 period / Yellow Zone 52 period / Green Zone 26 period]
Stochastic Momentum Index (SMI) at overbought level
Money flow momentum is spiked positive and over top of Bollinger Band
Price at or near Fibonacci level
Entry at $280
Target is lower channel around $250
I buy or sell when at three of these events happen:
* Price tags the top or bottom of parallel channel zones
* Money flow spikes beyond it's Bollinger Bands
* Stochastic Momentum Index (SMI) at near oversold overbought level
* Price at Fibonacci levels
So...
Here's why I'm picking this symbol to do the thing.
Price in selling zone at top of channels
[Red Line 100 period / Yellow Zone 52 period / Green Zone 26 period]
Stochastic Momentum Index (SMI) at overbought level
Money flow momentum is spiked positive and over top of Bollinger Band
Price at or near Fibonacci level
Entry at $280
Target is lower channel around $250
Trade closed manually
Out at $279 as price hit green channel and will probably go up again to $292. Money flow remains green and is only slightly declining.
Note
look at that. Price hit $292 on March 17 and I didn't have any shares. damn. Disclaimer
The information and publications are not meant to be, and do not constitute, financial, investment, trading, or other types of advice or recommendations supplied or endorsed by TradingView. Read more in the Terms of Use.
Disclaimer
The information and publications are not meant to be, and do not constitute, financial, investment, trading, or other types of advice or recommendations supplied or endorsed by TradingView. Read more in the Terms of Use.