1. Key Analysis and Levels
2. Trade Setup
3. Explanation of Analysis
4. Confirmation Signals
5. Risk Management
Why This Plan Works
This strategy leverages Elliott Wave Theory to anticipate high-probability reversal or continuation scenarios. It accounts for both bullish and bearish outcomes, ensuring a structured approach to risk and reward. The key levels and confirmation signals allow for timely and informed decision-making.
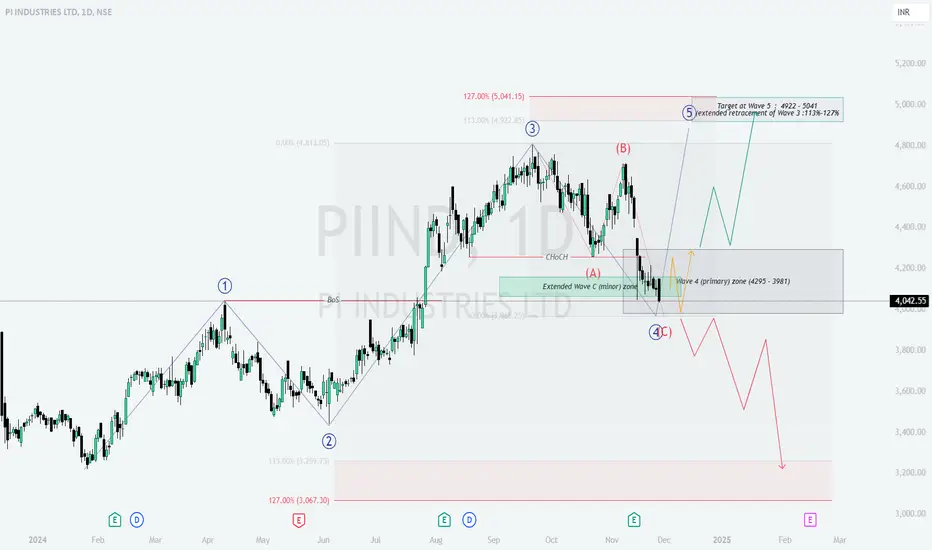
- Wave 4 (Primary) Zone (₹3981-₹4295):
The price is currently in the Wave 4 corrective zone, as per Elliott Wave Theory.
This zone is critical for determining whether the upward trend will resume (Wave 5) or break down further. - Wave C (Minor) Completion Zone:
Represents the lower boundary of the current corrective structure.
A bullish reversal is possible here if demand sustains. - Target at Wave 5 (₹4922-₹5041):
If the upward trend resumes, this is the extended retracement of Wave 3, and the logical profit zone for bulls. - Stop Loss Level (₹3980):
Positioned just below the Wave 4 corrective zone to manage downside risk.
2. Trade Setup
- A. Long Trade Setup:Why Long?
The price is at a critical support area within Wave 4, where buyers might step in.
Potential for continuation of the uptrend to form Wave 5.
Entry: Between ₹4000-₹4100, after observing bullish reversal signals (e.g., bullish candlesticks, volume surge).
Stop Loss: ₹3980, slightly below the Wave C completion zone.
Targets:
₹4700: Intermediate target at prior swing resistance.
₹4922-₹5041: Final target at Wave 5 extension. - B. Short Trade Setup (If Support Fails):Why Short?
A breakdown below ₹3980 would invalidate the Wave 4 support zone, signaling further downside.
Bearish continuation could lead to lower Fibonacci levels or prior demand zones.
Entry: Below ₹3980 after confirmation of breakdown with volume.
Targets:
₹3700: Immediate support level.
₹3250-₹3300: Major demand zone from previous Wave 2.
Stop Loss: ₹4080 to limit risk on false breakdowns.
3. Explanation of Analysis
- Wave 4 Correction:
Wave 4 is typically a corrective phase after a strong Wave 3 impulse. It often tests Fibonacci retracement zones (₹3981-₹4295). - Wave 5 Target:
If the uptrend resumes, Wave 5 is expected to extend to 113%-127% of Wave 3’s range (₹4922-₹5041). - Bearish Scenario:
Failure to hold Wave 4 corrective support would signal deeper correction, potentially targeting previous Wave 2 levels.
4. Confirmation Signals
- For Long Entry:
Price stability within ₹3981-₹4295 and bullish reversal patterns like hammer candles or bullish divergence (e.g., RSI).
Break above ₹4300 confirms Wave 4 completion. - For Short Entry:
Decisive breakdown below ₹3980 with strong bearish momentum (e.g., large red candle, volume spike).
5. Risk Management
- []Risk limited to 1-2% of trading capital per trade.
[]Use partial profit booking at intermediate targets (e.g., ₹4700) and move stop-loss to breakeven.
Why This Plan Works
This strategy leverages Elliott Wave Theory to anticipate high-probability reversal or continuation scenarios. It accounts for both bullish and bearish outcomes, ensuring a structured approach to risk and reward. The key levels and confirmation signals allow for timely and informed decision-making.
Disclaimer
The information and publications are not meant to be, and do not constitute, financial, investment, trading, or other types of advice or recommendations supplied or endorsed by TradingView. Read more in the Terms of Use.
Disclaimer
The information and publications are not meant to be, and do not constitute, financial, investment, trading, or other types of advice or recommendations supplied or endorsed by TradingView. Read more in the Terms of Use.