Hello traders, I hope you're all doing well!
Currently, we're seeing an interesting setup on PI that could lead to a potential bullish move. Let's break it down:
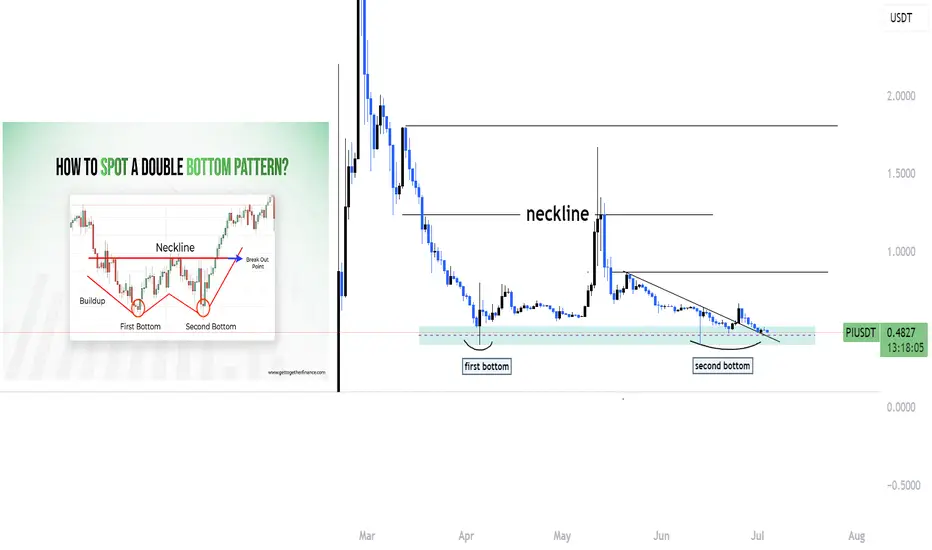
🔹 Double Bottom Formation
PI appears to be forming a double bottom on the higher time frame — a classic bullish reversal pattern. This indicates that the market has tested a key support level twice and failed to break lower, which often suggests that selling pressure is weakening.
🔹 Trendline Breakout
In addition to the double bottom, we’ve also broken out of a descending trendline that has been acting as dynamic resistance for some time. A clean breakout with volume often signals a shift in market structure from bearish to bullish.
🔹 Strong Support Zone & Liquidity
We are still holding above a strong support zone, where previous demand has stepped in. This area has likely accumulated a lot of liquidity, with stop-losses from retail traders sitting just below. If price holds this level, it may trap sellers and trigger a short squeeze, pushing the price higher.
🔹 Possible Upside Move
As long as we remain above this support and confirmation continues, there is a high probability of an upward continuation. This could be the start of a bullish leg, especially if we see a break of recent highs with strength.
📈 Conclusion
This confluence of technical signals — double bottom, trendline breakout, and liquidity resting below support — gives us a strong reason to watch this setup closely.
👉 Like and follow if you’re seeing the same structure or planning to trade this move. Let’s ride it together!
Currently, we're seeing an interesting setup on PI that could lead to a potential bullish move. Let's break it down:
🔹 Double Bottom Formation
PI appears to be forming a double bottom on the higher time frame — a classic bullish reversal pattern. This indicates that the market has tested a key support level twice and failed to break lower, which often suggests that selling pressure is weakening.
🔹 Trendline Breakout
In addition to the double bottom, we’ve also broken out of a descending trendline that has been acting as dynamic resistance for some time. A clean breakout with volume often signals a shift in market structure from bearish to bullish.
🔹 Strong Support Zone & Liquidity
We are still holding above a strong support zone, where previous demand has stepped in. This area has likely accumulated a lot of liquidity, with stop-losses from retail traders sitting just below. If price holds this level, it may trap sellers and trigger a short squeeze, pushing the price higher.
🔹 Possible Upside Move
As long as we remain above this support and confirmation continues, there is a high probability of an upward continuation. This could be the start of a bullish leg, especially if we see a break of recent highs with strength.
📈 Conclusion
This confluence of technical signals — double bottom, trendline breakout, and liquidity resting below support — gives us a strong reason to watch this setup closely.
👉 Like and follow if you’re seeing the same structure or planning to trade this move. Let’s ride it together!
Disclaimer
The information and publications are not meant to be, and do not constitute, financial, investment, trading, or other types of advice or recommendations supplied or endorsed by TradingView. Read more in the Terms of Use.
Disclaimer
The information and publications are not meant to be, and do not constitute, financial, investment, trading, or other types of advice or recommendations supplied or endorsed by TradingView. Read more in the Terms of Use.