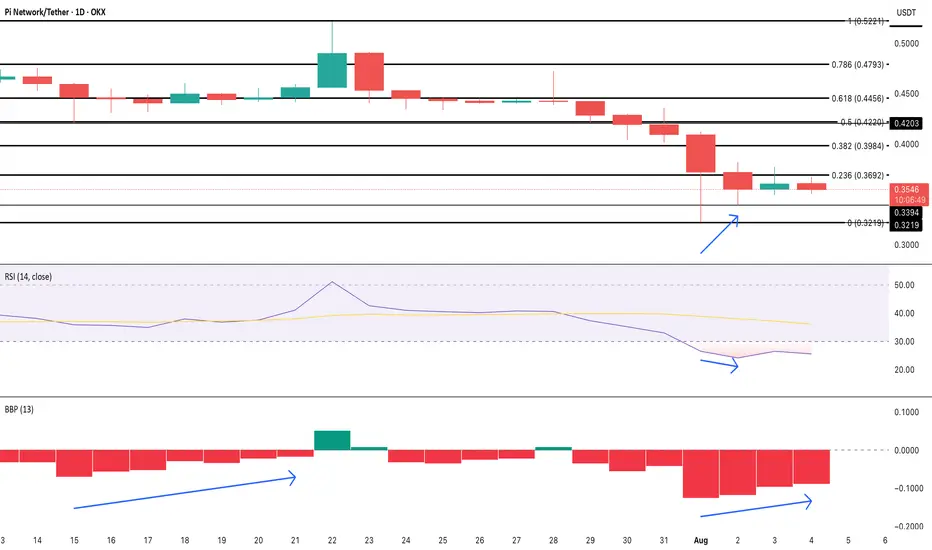
The first encouraging sign comes from the Bull-Bear Power (BBP) indicator. This tool tracks the strength of bulls vs. bears by comparing price extremes with a moving average. Since August 1, BBP has been rising, flipping from a deeply negative zone to a softer print. That same behavior last occurred in mid-July, just before a bounce from $0.45 to $0.52. It’s not a confirmation, but it’s not nothing.
Backing this up is the RSI (Relative Strength Index), which has formed a hidden bullish divergence on the 4-hour chart. While the RSI dipped lower, price held a higher low; a classic setup that often appears right before continuation moves in an uptrend. RSI is still at 23, deep in oversold territory, but this divergence hints that sellers may be tiring.
There’s a sentiment twist too.
Still, nothing breaks unless the price does.
Truly Unbiased Cryptocurrency News beincrypto.com
Disclaimer
The information and publications are not meant to be, and do not constitute, financial, investment, trading, or other types of advice or recommendations supplied or endorsed by TradingView. Read more in the Terms of Use.
Truly Unbiased Cryptocurrency News beincrypto.com
Disclaimer
The information and publications are not meant to be, and do not constitute, financial, investment, trading, or other types of advice or recommendations supplied or endorsed by TradingView. Read more in the Terms of Use.