Long
PIVX | Highest Volume Ever Means Bullish Wave!
A few weeks ago I opened a new layout and activated all the classic indicators: A bunch of eMoving-averages, the RSI and MACD. It loads up the whole screen and the chart becomes heavy loaded; the information is quite useful though.
The data coming from the RSI and MACD can be excellent to determine if a reversal is true or false, to predict a reversal (divergences) and to confirm long-term trends (readings and direction on higher timeframes), but once you have experience, just looking at the MACD and RSI once on one chart can tell you what all the others say. And thus the market cycle reins supreme.
➢ I like to keep the chart squeaky clean; easy for your eyes to read.
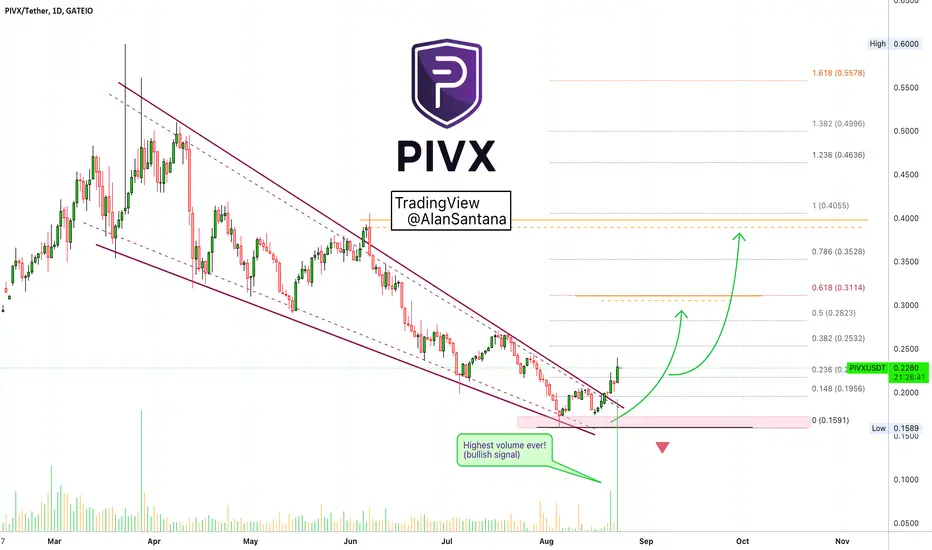
➖ PIVXUSDT is breaking up. This "breaking up" we call a bullish-breakout because the descending trendline has been broken. Here the descending trendline is shown as part of a falling wedge pattern. When a trendline breaks, we say the trend is over; in this case a downtrend.
➖ The bullish-breakout is supported by the highest volume ever. This is a significant signal. This can mean that the low is in, or that we will have a bullish wave in the least. If prices move back down, we can easily get a higher low or the next low would mark the bottom, because of the high volume.
That's is all... PIVXUSDT is set to go up.
Thanks a lot for your support.
Namaste.
The data coming from the RSI and MACD can be excellent to determine if a reversal is true or false, to predict a reversal (divergences) and to confirm long-term trends (readings and direction on higher timeframes), but once you have experience, just looking at the MACD and RSI once on one chart can tell you what all the others say. And thus the market cycle reins supreme.
➢ I like to keep the chart squeaky clean; easy for your eyes to read.
➖ PIVXUSDT is breaking up. This "breaking up" we call a bullish-breakout because the descending trendline has been broken. Here the descending trendline is shown as part of a falling wedge pattern. When a trendline breaks, we say the trend is over; in this case a downtrend.
➖ The bullish-breakout is supported by the highest volume ever. This is a significant signal. This can mean that the low is in, or that we will have a bullish wave in the least. If prices move back down, we can easily get a higher low or the next low would mark the bottom, because of the high volume.
That's is all... PIVXUSDT is set to go up.
Thanks a lot for your support.
Namaste.
Trade active
PIVXUSDT is about to perform a strong price advance. Friendly reminder.🚨 FREE PREMIUM Trades + Top Results
t.me/anandatrades/1183
🚨 FREE Quality Content + New Results
(Frequent Discounts & Offers)
t.me/masteranandatrades/6172
🚨 Go beyond! PREMIUM LIFETIME Access
lamatrades.com (Since 2017)
t.me/anandatrades/1183
🚨 FREE Quality Content + New Results
(Frequent Discounts & Offers)
t.me/masteranandatrades/6172
🚨 Go beyond! PREMIUM LIFETIME Access
lamatrades.com (Since 2017)
Related publications
Disclaimer
The information and publications are not meant to be, and do not constitute, financial, investment, trading, or other types of advice or recommendations supplied or endorsed by TradingView. Read more in the Terms of Use.
🚨 FREE PREMIUM Trades + Top Results
t.me/anandatrades/1183
🚨 FREE Quality Content + New Results
(Frequent Discounts & Offers)
t.me/masteranandatrades/6172
🚨 Go beyond! PREMIUM LIFETIME Access
lamatrades.com (Since 2017)
t.me/anandatrades/1183
🚨 FREE Quality Content + New Results
(Frequent Discounts & Offers)
t.me/masteranandatrades/6172
🚨 Go beyond! PREMIUM LIFETIME Access
lamatrades.com (Since 2017)
Related publications
Disclaimer
The information and publications are not meant to be, and do not constitute, financial, investment, trading, or other types of advice or recommendations supplied or endorsed by TradingView. Read more in the Terms of Use.