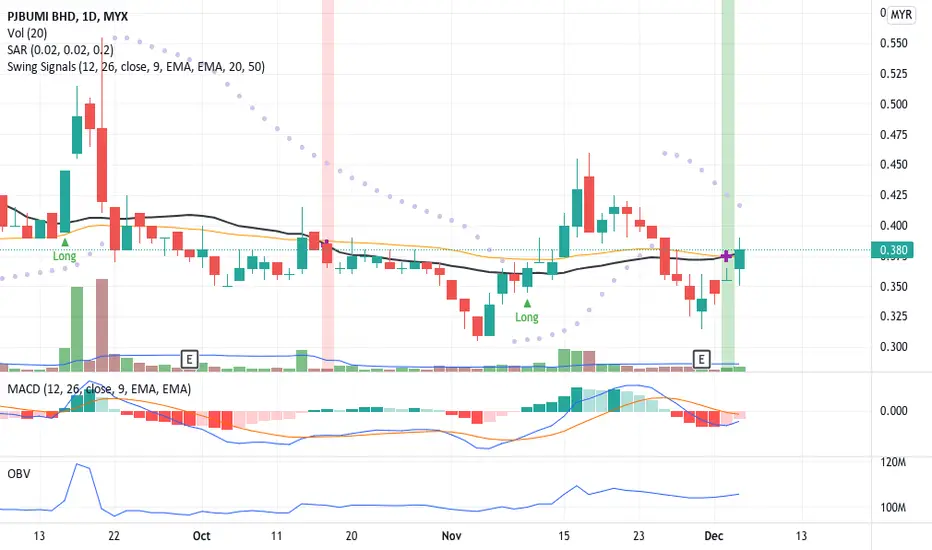
Continuous price rally up after a rebound from the support line and candlestick body closed above MA20 indicate PJBUMI is in uptrend pattern.
Moreover, after the MA20 line crosses up the MA50 line indicates a high probability of a long trade position.
Precaution since the volume was below the MA20 line there was no buying interest from the trader.
OBV chart indicates a divergence signal.
Let put PJBUMI in WJ and watch out for significant price movement with volume to confirm the price movement.
R 0.400
S 0.335
Disclaimer
The information and publications are not meant to be, and do not constitute, financial, investment, trading, or other types of advice or recommendations supplied or endorsed by TradingView. Read more in the Terms of Use.
Disclaimer
The information and publications are not meant to be, and do not constitute, financial, investment, trading, or other types of advice or recommendations supplied or endorsed by TradingView. Read more in the Terms of Use.