Day Chart
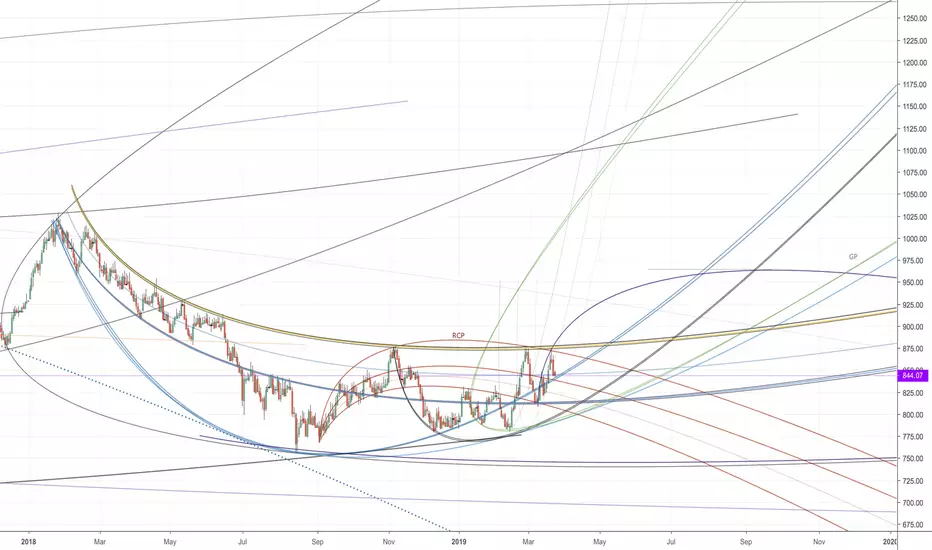
The real resistance is in yellow.
The green parabola is the area of growth. Blue Parabolas are the expansion trend.
Platinum is nearly escaped from the Red Convex Parabolas. Its either doing nothing. trading between blue and Yalow or up between Blue and Black.
The real resistance is in yellow.
The green parabola is the area of growth. Blue Parabolas are the expansion trend.
Platinum is nearly escaped from the Red Convex Parabolas. Its either doing nothing. trading between blue and Yalow or up between Blue and Black.
Note
We are Above Major Resistance . Double yellow!!!Disclaimer
The information and publications are not meant to be, and do not constitute, financial, investment, trading, or other types of advice or recommendations supplied or endorsed by TradingView. Read more in the Terms of Use.
Disclaimer
The information and publications are not meant to be, and do not constitute, financial, investment, trading, or other types of advice or recommendations supplied or endorsed by TradingView. Read more in the Terms of Use.