National-security software firm Palantir Technologies  PLTR hit a new all-time high this week and has gained more than 600% since hitting a 52-week low last August. What does technical and fundamental analysis say could happen next?
Let's look:
Palantir's Fundamental Analysis
PLTR has been on a tear of late, hitting a $153.91 intraday record high on Thursday. (Full disclosure: I own the stock.)
Shares have been rising in part because NATO member nations recently agreed to increase defense and defense-related infrastructure spending to 5% of each country's gross domestic product -- news that could play right into the company's hands.
Only Spain opted out from among the 32 Western nations that belong to the military alliance, although Canada went along only somewhat reluctantly.
The move surprised many NATO observers. Just some eight years ago, President Trump couldn't get a majority of these nations during his first term to pay what he called their "fair share" -- which was then mandated at only 2% of GDP.
But having a hostile Russian Army in Ukraine knocking at NATO's front door has changed global perceptions of what's fiscally necessary and what's not. Spain and Canada are far away from the Russia-Ukraine war, but some NATO members physically closer to the fighting have far more enthusiastically embraced the new 5% spending target.
What becomes of these promises to boost military spending?
There will, no doubt, still be costly purchases of expensive military hardware like tanks, artillery, aircraft and naval vessels. But intelligence provided by the kind of data-based, AI-assisted analysis that Palantir sells seems likely to only grow in significance.
Purchasing such intelligence (or the high-tech, modern systems to gather it) looks to be far more cost-effective than simply throwing money at things like submarines and fighter aircraft.
That's what nations need these days for national security, as well as what many large businesses need just to compete. All of that sounds like music to Palantir's ears.
The company will report Q2 earnings after the closing bell on Aug. 4, with analysts looking for the firm to post $0.14 in adjusted earnings per share on $939.3 million of revenue.
That would represent a 55.6% increase from the $0.09 in adjusted EPS and 38.5% improvement on the $678.1 million in revenues that PLTR reported for the same period last year.
Of the 19 sell-side analysts I found that cover Palantir, 12 have revised their earnings estimates higher since the current quarter began, while three have lowered their forecasts.
Palantir's Technical Analysis
Now let's take a look at PLTR's charts, beginning with this one that runs from January through Tuesday afternoon:

Readers will first note that Palantir continues to break out from the bullish "cup-with-handle" pattern that became visible this spring (shaded purple in the chart above).
The stock's Relative Strength Index (the gray line at the chart's top) also remains quite robust, but is not yet technically overbought.
Similarly, Palantir's daily Moving Average Convergence Divergence indicator (or "MACD," marked with gold and black lines and blue bars at the chart's bottom) is postured bullishly as well.
Within that MACD, the histogram of the stock's 9-day Exponential Moving Average (or "EMA," denoted with blue bars) is above zero. That's often seen technically as short-term bullish.
Meanwhile, Palantir's 12-day EMA (the black line) is back above its 26-day EMA (the gold line), with both in positive territory. That's also a historically bullish signal.
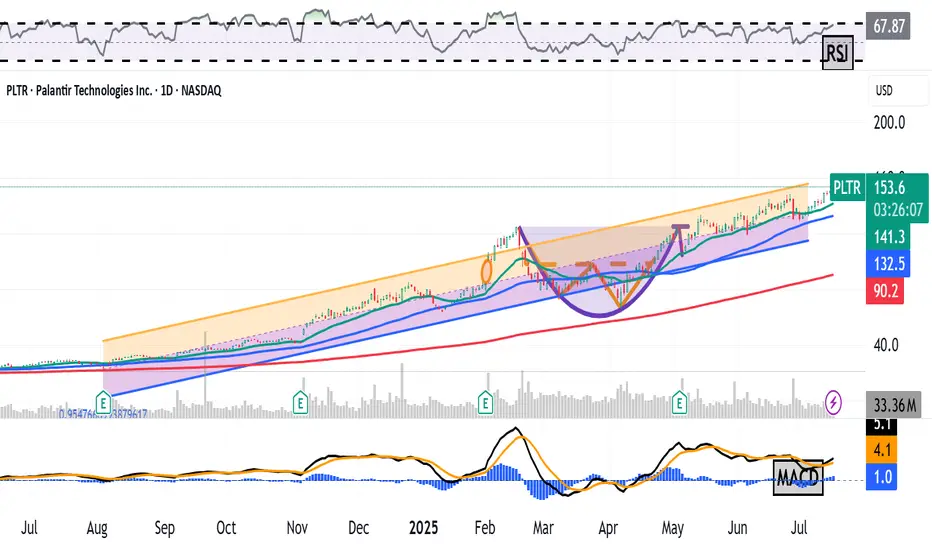
Now let's look at PLTR's chart going back 12 months:

Taking a longer look back, we can take a Raff Regression model (the orange and purple field above) and place it over the stock's price action to better illustrate the trend that's in place.
This view shows PLTR riding its 21-day EMA (the green line above) since mid-April.
Palantir's current pivot is the upper trendline of the model -- about $156 in the chart above vs. the $153.43 that PLTR was trading at on Thursday afternoon.
The stock's 50-day SMA (the blue line at $131.40 in the chart above) represents PLTR's downside pivot, with the Raff Regression model's lower trendline not too far below that for potential support.
(Moomoo Technologies Inc. Markets Commentator Stephen “Sarge” Guilfoyle was long PLTR at the time of writing this column.)
This article discusses technical analysis, other approaches, including fundamental analysis, may offer very different views. The examples provided are for illustrative purposes only and are not intended to be reflective of the results you can expect to achieve. Specific security charts used are for illustrative purposes only and are not a recommendation, offer to sell, or a solicitation of an offer to buy any security. Past investment performance does not indicate or guarantee future success. Returns will vary, and all investments carry risks, including loss of principal. This content is also not a research report and is not intended to serve as the basis for any investment decision. The information contained in this article does not purport to be a complete description of the securities, markets, or developments referred to in this material. Moomoo and its affiliates make no representation or warranty as to the article's adequacy, completeness, accuracy or timeliness for any particular purpose of the above content. Furthermore, there is no guarantee that any statements, estimates, price targets, opinions or forecasts provided herein will prove to be correct.
Moomoo is a financial information and trading app offered by Moomoo Technologies Inc. In the U.S., investment products and services on Moomoo are offered by Moomoo Financial Inc., Member FINRA/SIPC.
TradingView is an independent third party not affiliated with Moomoo Financial Inc., Moomoo Technologies Inc., or its affiliates. Moomoo Financial Inc. and its affiliates do not endorse, represent or warrant the completeness and accuracy of the data and information available on the TradingView platform and are not responsible for any services provided by the third-party platform.
Let's look:
Palantir's Fundamental Analysis
PLTR has been on a tear of late, hitting a $153.91 intraday record high on Thursday. (Full disclosure: I own the stock.)
Shares have been rising in part because NATO member nations recently agreed to increase defense and defense-related infrastructure spending to 5% of each country's gross domestic product -- news that could play right into the company's hands.
Only Spain opted out from among the 32 Western nations that belong to the military alliance, although Canada went along only somewhat reluctantly.
The move surprised many NATO observers. Just some eight years ago, President Trump couldn't get a majority of these nations during his first term to pay what he called their "fair share" -- which was then mandated at only 2% of GDP.
But having a hostile Russian Army in Ukraine knocking at NATO's front door has changed global perceptions of what's fiscally necessary and what's not. Spain and Canada are far away from the Russia-Ukraine war, but some NATO members physically closer to the fighting have far more enthusiastically embraced the new 5% spending target.
What becomes of these promises to boost military spending?
There will, no doubt, still be costly purchases of expensive military hardware like tanks, artillery, aircraft and naval vessels. But intelligence provided by the kind of data-based, AI-assisted analysis that Palantir sells seems likely to only grow in significance.
Purchasing such intelligence (or the high-tech, modern systems to gather it) looks to be far more cost-effective than simply throwing money at things like submarines and fighter aircraft.
That's what nations need these days for national security, as well as what many large businesses need just to compete. All of that sounds like music to Palantir's ears.
The company will report Q2 earnings after the closing bell on Aug. 4, with analysts looking for the firm to post $0.14 in adjusted earnings per share on $939.3 million of revenue.
That would represent a 55.6% increase from the $0.09 in adjusted EPS and 38.5% improvement on the $678.1 million in revenues that PLTR reported for the same period last year.
Of the 19 sell-side analysts I found that cover Palantir, 12 have revised their earnings estimates higher since the current quarter began, while three have lowered their forecasts.
Palantir's Technical Analysis
Now let's take a look at PLTR's charts, beginning with this one that runs from January through Tuesday afternoon:
Readers will first note that Palantir continues to break out from the bullish "cup-with-handle" pattern that became visible this spring (shaded purple in the chart above).
The stock's Relative Strength Index (the gray line at the chart's top) also remains quite robust, but is not yet technically overbought.
Similarly, Palantir's daily Moving Average Convergence Divergence indicator (or "MACD," marked with gold and black lines and blue bars at the chart's bottom) is postured bullishly as well.
Within that MACD, the histogram of the stock's 9-day Exponential Moving Average (or "EMA," denoted with blue bars) is above zero. That's often seen technically as short-term bullish.
Meanwhile, Palantir's 12-day EMA (the black line) is back above its 26-day EMA (the gold line), with both in positive territory. That's also a historically bullish signal.
Now let's look at PLTR's chart going back 12 months:
Taking a longer look back, we can take a Raff Regression model (the orange and purple field above) and place it over the stock's price action to better illustrate the trend that's in place.
This view shows PLTR riding its 21-day EMA (the green line above) since mid-April.
Palantir's current pivot is the upper trendline of the model -- about $156 in the chart above vs. the $153.43 that PLTR was trading at on Thursday afternoon.
The stock's 50-day SMA (the blue line at $131.40 in the chart above) represents PLTR's downside pivot, with the Raff Regression model's lower trendline not too far below that for potential support.
(Moomoo Technologies Inc. Markets Commentator Stephen “Sarge” Guilfoyle was long PLTR at the time of writing this column.)
This article discusses technical analysis, other approaches, including fundamental analysis, may offer very different views. The examples provided are for illustrative purposes only and are not intended to be reflective of the results you can expect to achieve. Specific security charts used are for illustrative purposes only and are not a recommendation, offer to sell, or a solicitation of an offer to buy any security. Past investment performance does not indicate or guarantee future success. Returns will vary, and all investments carry risks, including loss of principal. This content is also not a research report and is not intended to serve as the basis for any investment decision. The information contained in this article does not purport to be a complete description of the securities, markets, or developments referred to in this material. Moomoo and its affiliates make no representation or warranty as to the article's adequacy, completeness, accuracy or timeliness for any particular purpose of the above content. Furthermore, there is no guarantee that any statements, estimates, price targets, opinions or forecasts provided herein will prove to be correct.
Moomoo is a financial information and trading app offered by Moomoo Technologies Inc. In the U.S., investment products and services on Moomoo are offered by Moomoo Financial Inc., Member FINRA/SIPC.
TradingView is an independent third party not affiliated with Moomoo Financial Inc., Moomoo Technologies Inc., or its affiliates. Moomoo Financial Inc. and its affiliates do not endorse, represent or warrant the completeness and accuracy of the data and information available on the TradingView platform and are not responsible for any services provided by the third-party platform.
Disclaimer
The information and publications are not meant to be, and do not constitute, financial, investment, trading, or other types of advice or recommendations supplied or endorsed by TradingView. Read more in the Terms of Use.
Disclaimer
The information and publications are not meant to be, and do not constitute, financial, investment, trading, or other types of advice or recommendations supplied or endorsed by TradingView. Read more in the Terms of Use.