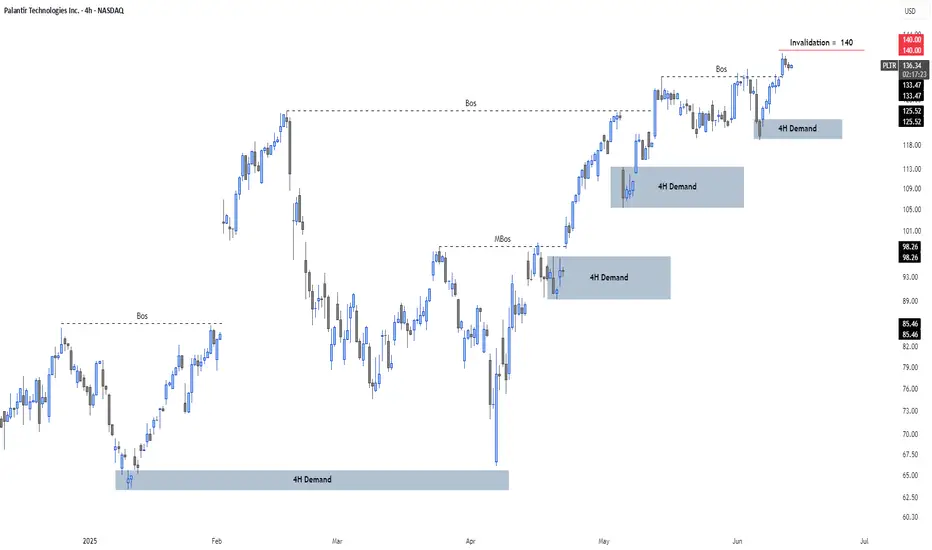
Palantir is compressing near ATHs, but showing early signs of exhaustion on higher timeframes. On the 4H chart, structure is still bullish — but fragile.
🔍 Key Technical Structure
• Series of Breaks of Structure (BoS) confirming the bullish trend
• Price is currently sitting above the $125 4H demand zone, near previous highs
• Invalidation for the bearish thesis sits at $140
🧭 Strategy Outlook
If $125.50 fails:
→ Next demand: $113.00–$105.00
→ Below that: strong support zone at $98.00–$89.00
If $140 breaks and holds:
→ Bearish divergence invalidated
→ Continuation toward new highs likely
📌 Summary
Price is at an inflection point. Structure remains bullish, but momentum is weakening across higher timeframes and RSI divergence is still active.
Watching $125.50 as the trigger:
Below = potential sell-off
Above = stay patient
Related publications
Disclaimer
The information and publications are not meant to be, and do not constitute, financial, investment, trading, or other types of advice or recommendations supplied or endorsed by TradingView. Read more in the Terms of Use.
Related publications
Disclaimer
The information and publications are not meant to be, and do not constitute, financial, investment, trading, or other types of advice or recommendations supplied or endorsed by TradingView. Read more in the Terms of Use.