Here's a breakdown and technical analysis of the **PLUME/USDT (1D, Heikin Ashi, MEXC)** chart you provided:
---
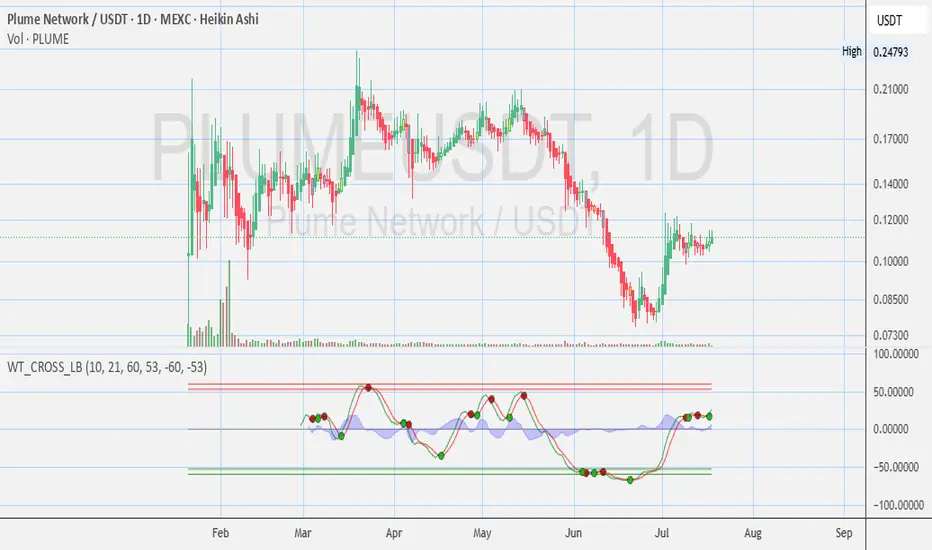
📊 **Chart Overview:**
* **Current Price:** Around **\$0.1115**
* **Price Action:** Currently in a short-term **uptrend** after a significant downtrend.
* **Volume:** Noticeable **increase in volume** during the recent reversal in early July, indicating strong buying interest.
---
🔍 **Heikin Ashi Candles:**
* Heikin Ashi smooths out price action.
* **Recent candles are green** and fairly consistent in body size, suggesting **bullish momentum**.
* Prior to this, there was a long series of **red candles** from late May to late June indicating strong bearish sentiment, which now appears to be reversing.
---
📈 **Support and Resistance:**
* **Support Zone:** Around **\$0.085 - \$0.090** (confirmed by the recent bounce).
* **Current Resistance:** Near **\$0.120 - \$0.125** (the price is consolidating just below this).
* **Major Resistance above:** \~**\$0.14 - \$0.15**, then \~\$0.17
---
📉 **WT\_CROSS\_LB Indicator (WaveTrend Oscillator):**
* **WaveTrend lines are crossing above 0**, and staying strong, indicating a continuation of **bullish momentum**.
* The last red and green dots suggest a bullish cross occurred recently and is still valid.
* The oscillator is not yet in the overbought zone (above 60), which means there’s still **room for upward movement**.
---
🔎 **Trend Analysis:**
* **Trend Reversal:** Confirmed with rising price and increasing volume.
* **Higher Lows Forming:** This is a bullish sign, suggesting accumulation phase or early trend reversal.
✅ Bullish Signals:
* Strong bounce from \~\$0.085
* Bullish Heikin Ashi candles and WaveTrend crossover
* Good volume support on the reversal
⚠️ Caution:
* Facing resistance near \$0.120 — need to break and hold above to confirm next leg up.
* Potential for short-term pullback before further upside
--
Disclosures:
This analysis is for informational purposes only and is not financial advice. It does not constitute a recommendation to buy, sell, or trade any securities, cryptocurrencies, or stocks. Trading involves significant risk, and you should consult with a qualified financial advisor before making any investment decisions. Past performance is not indicative of future results.
---
📊 **Chart Overview:**
* **Current Price:** Around **\$0.1115**
* **Price Action:** Currently in a short-term **uptrend** after a significant downtrend.
* **Volume:** Noticeable **increase in volume** during the recent reversal in early July, indicating strong buying interest.
---
🔍 **Heikin Ashi Candles:**
* Heikin Ashi smooths out price action.
* **Recent candles are green** and fairly consistent in body size, suggesting **bullish momentum**.
* Prior to this, there was a long series of **red candles** from late May to late June indicating strong bearish sentiment, which now appears to be reversing.
---
📈 **Support and Resistance:**
* **Support Zone:** Around **\$0.085 - \$0.090** (confirmed by the recent bounce).
* **Current Resistance:** Near **\$0.120 - \$0.125** (the price is consolidating just below this).
* **Major Resistance above:** \~**\$0.14 - \$0.15**, then \~\$0.17
---
📉 **WT\_CROSS\_LB Indicator (WaveTrend Oscillator):**
* **WaveTrend lines are crossing above 0**, and staying strong, indicating a continuation of **bullish momentum**.
* The last red and green dots suggest a bullish cross occurred recently and is still valid.
* The oscillator is not yet in the overbought zone (above 60), which means there’s still **room for upward movement**.
---
🔎 **Trend Analysis:**
* **Trend Reversal:** Confirmed with rising price and increasing volume.
* **Higher Lows Forming:** This is a bullish sign, suggesting accumulation phase or early trend reversal.
✅ Bullish Signals:
* Strong bounce from \~\$0.085
* Bullish Heikin Ashi candles and WaveTrend crossover
* Good volume support on the reversal
⚠️ Caution:
* Facing resistance near \$0.120 — need to break and hold above to confirm next leg up.
* Potential for short-term pullback before further upside
--
Disclosures:
This analysis is for informational purposes only and is not financial advice. It does not constitute a recommendation to buy, sell, or trade any securities, cryptocurrencies, or stocks. Trading involves significant risk, and you should consult with a qualified financial advisor before making any investment decisions. Past performance is not indicative of future results.
Disclaimer
The information and publications are not meant to be, and do not constitute, financial, investment, trading, or other types of advice or recommendations supplied or endorsed by TradingView. Read more in the Terms of Use.
Disclaimer
The information and publications are not meant to be, and do not constitute, financial, investment, trading, or other types of advice or recommendations supplied or endorsed by TradingView. Read more in the Terms of Use.