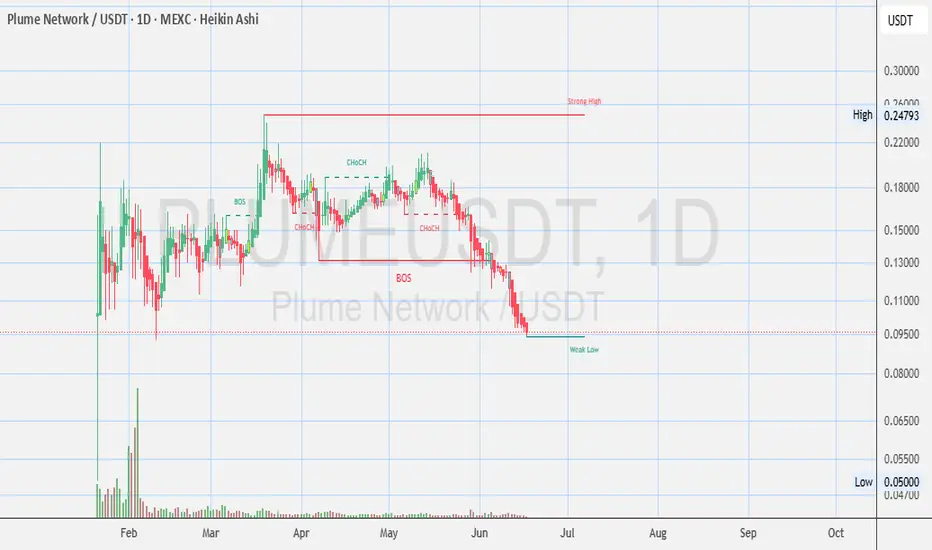
technical analysis of the Plume Network (PLUME/USDT) – Daily (1D) chart on MEXC with Heikin Ashi candles:
📉 Overview & Current Market Conditions
Price: ~$0.13566
Change: -2.17% (down today)
Chart Type: Heikin Ashi (smoothed candle view)
Trend: Clear downtrend in place since mid-May
Market Structure Tools: BOS, CHoCH, EQH, Weak/Strong Highs & Lows
🔍 Key Observations
📉 Trend Analysis
Primary Trend: Bearish
Lower highs and lower lows are clearly established.
Multiple Breaks of Structure (BOS) confirm continued downward momentum.
The recent Change of Character (CHoCH) attempts around late April and early May failed, indicating no sustained bullish control.
🟦 Support & Resistance Zones
Support (Weak Low): Around $0.095 – $0.096
Price is currently sitting at or just above this level.
If it breaks below, the next zone is likely $0.075 or even sub-$0.05
Resistance:
Nearest: ~$0.15 – $0.16 (former structure level)
Mid-range: ~$0.18 – $0.20 (clustered range rejections)
Major Resistance (Strong High): ~$0.24
📊 Volume Insight
Volume spikes are mostly associated with sell candles, particularly in the recent dump from ~$0.16 to ~$0.13.
Buy volume is not notable enough to suggest reversal strength.
⚠️ Risk Assessment
Weak low label suggests liquidity grab or potential for further drop.
No confirmed reversal signal.
Price could enter price discovery mode to the downside if $0.095 breaks convincingly.
🧭 Trading Scenarios
✅ Bullish Case (Speculative Reversal)
Hold above $0.095 + strong volume bounce = possible short-term reversal.
Confirmation needed through a CHoCH back above $0.15 and reclaim of market structure.
❌ Bearish Case (Dominant)
Breakdown below $0.095 with volume = likely continuation to next liquidity pocket below $0.075
No major support levels visible until historical lows.
📝 Summary for Plume Network (PLUME/USDT)
Plume Network (PLUME) remains in a strong bearish trend, now testing a critical weak support zone around $0.095. Despite earlier bullish structure changes, sellers have regained control since May. If the current support breaks, price could explore significantly lower levels. Buyers must wait for a clear structure shift and volume confirmation before considering upside potential.
--
Disclosures:
This analysis is for informational purposes only and is not financial advice. It does not constitute a recommendation to buy, sell, or trade any securities, cryptocurrencies, or stocks. Trading involves significant risk, and you should consult with a qualified financial advisor before making any investment decisions. Past performance is not indicative of future results.
Disclaimer
The information and publications are not meant to be, and do not constitute, financial, investment, trading, or other types of advice or recommendations supplied or endorsed by TradingView. Read more in the Terms of Use.
Disclaimer
The information and publications are not meant to be, and do not constitute, financial, investment, trading, or other types of advice or recommendations supplied or endorsed by TradingView. Read more in the Terms of Use.