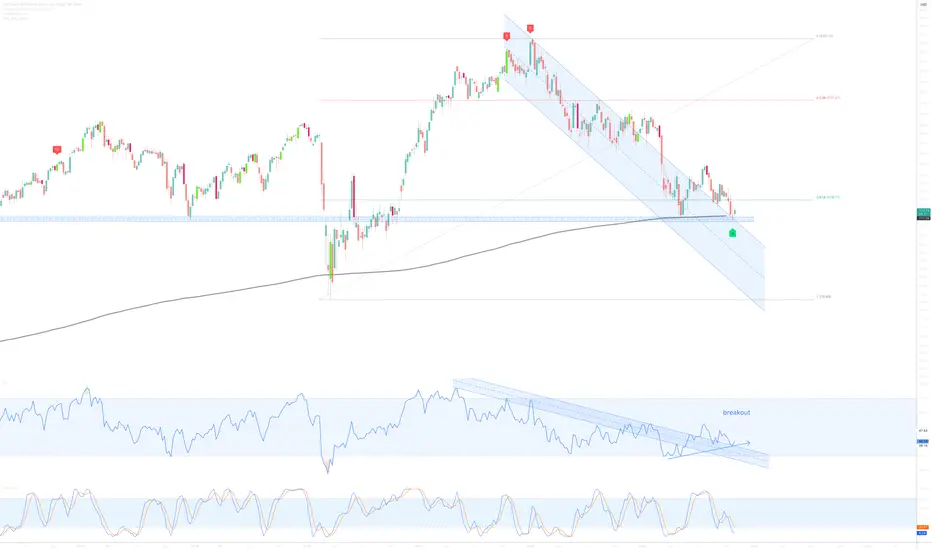
On the above weekly chart price action has corrected 50%. A number of reasons now exist to be long, including:
1) RSI resistance breakout.
2) Regular bullish divergence. Measured over 2-months.
3) A Double bottom prints.
3) Price action prints on the 100-week RMA with the divergence. Look left.
Is it possible price action corrects further? Sure.
Is it probable? No.
Ww
Type: trade
Risk: 6%
Timeframe for long: A week or two.
Return: 50% minimum
Stopless: 94
Trade active
Past resistance confirms support.Up around 10% so far, 40% to go. Although a move to 250 seems probable.
Note
25% so far, 25% to go.Note
30%. Expect resistance around $50Note
Correction, expect resistance around 150 not 50. Although consider sellers are exhausted, resistance could be weak.Note
Long again from 130.Got a near identical trade, will share...
Trade active
Trade active
55% so far. Stay long.Note
Onwards and upwards.Trade active
70% return so far.Stay long.
$250 is next point of interest. Remind me below for updates.
BTC
bc1q2eckdzh0q8vsd7swcc8et6ze7s99khhxyl7zwy
Weblink: patreon.com/withoutworries
Allow 3-6 months on ideas. Not investment advice. DYOR
bc1q2eckdzh0q8vsd7swcc8et6ze7s99khhxyl7zwy
Weblink: patreon.com/withoutworries
Allow 3-6 months on ideas. Not investment advice. DYOR
Disclaimer
The information and publications are not meant to be, and do not constitute, financial, investment, trading, or other types of advice or recommendations supplied or endorsed by TradingView. Read more in the Terms of Use.