Long
Polkastarter (POLS)

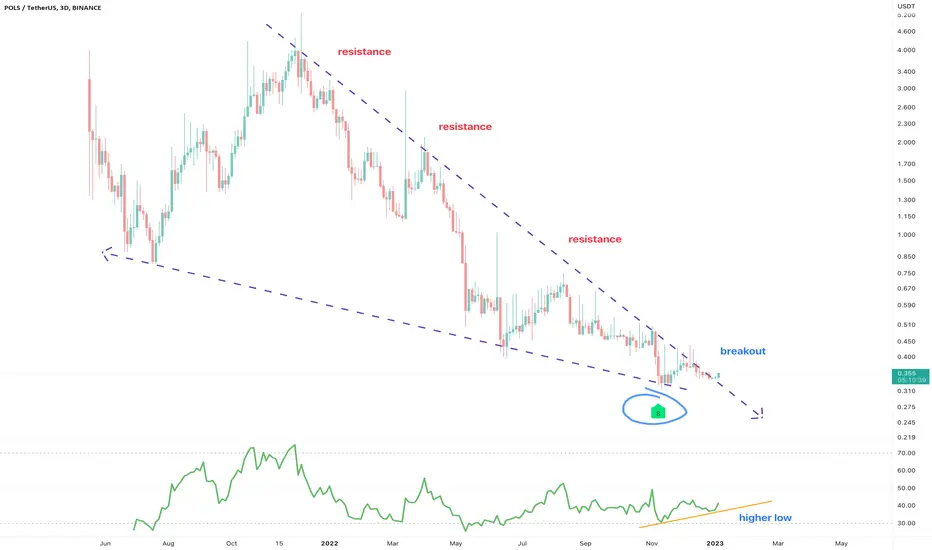
On the above 3-day chart price action has corrected over 90% since the sell signal in October 2021 (not shown). Now is a good opportunity to go long. Why?
1) A strong buy signal prints. (not shown).
2) Price action resistance breakout.
3) Strong positive divergence between price action and multiple oscillators. This divergence occurs over a 90 day period. The idea is a mirror copy of the LCX idea 48hrs ago.
Is it possible price action could fall further? Sure.
Is it probable? No.
Ww
Type: trade
Risk: <=6% of portfolio
Timeframe: Don’t know.
Return: Don’t know.
Trade active
Trade active
GRM support confirmed. As with every other token that has 'popped' recently, we first saw GRM support beforehand.Trade active
GRM support confirmed (again). Price action moved up 50% on the last confirmation. Will this time be different? No and no.Trade active
Uptrend continues. Don't miss this next impulsive move.PS:
A few messages / PMs that ask about my position in this trade etc.
Folks, 90% of the ideas published by WW are without positions by myself, just sharing the idea! Pay it forward and all that.
Trade closed: stop reached
BTC
bc1q2eckdzh0q8vsd7swcc8et6ze7s99khhxyl7zwy
Weblink: patreon.com/withoutworries
Allow 3-6 months on ideas. Not investment advice. DYOR
bc1q2eckdzh0q8vsd7swcc8et6ze7s99khhxyl7zwy
Weblink: patreon.com/withoutworries
Allow 3-6 months on ideas. Not investment advice. DYOR
Disclaimer
The information and publications are not meant to be, and do not constitute, financial, investment, trading, or other types of advice or recommendations supplied or endorsed by TradingView. Read more in the Terms of Use.
