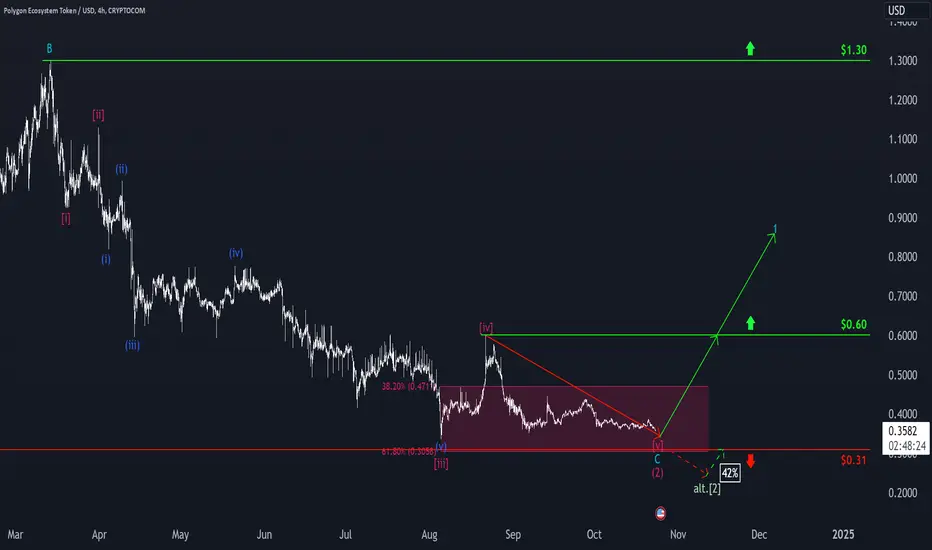
In the Polygon chart, we primarily expect an imminent lower low of the magenta wave (2) within our magenta Target Zone (between $0.4711 and $0.3058) before a trend reversal occurs. Afterward, a significant uptrend should begin, starting with the turquoise wave 1, which should break through the resistance level at $0.60. You can use our zone to establish long positions, with stop-losses placed 1% below the low or directly at the support level of $0.31 to minimize downside risk. If the coin breaks downward out of our Zone (42% likely), we will have to expect a further drop with the green wave alt.(2).
📊 Free daily market insights combining macro + Elliott Wave analysis
🚀 Spot trends early with momentum, sentiment & price structure
🌐 Join thousands trading smarter - full free analyses at dailymarketupdate.com
🚀 Spot trends early with momentum, sentiment & price structure
🌐 Join thousands trading smarter - full free analyses at dailymarketupdate.com
Disclaimer
The information and publications are not meant to be, and do not constitute, financial, investment, trading, or other types of advice or recommendations supplied or endorsed by TradingView. Read more in the Terms of Use.