📊 Chart Overview:
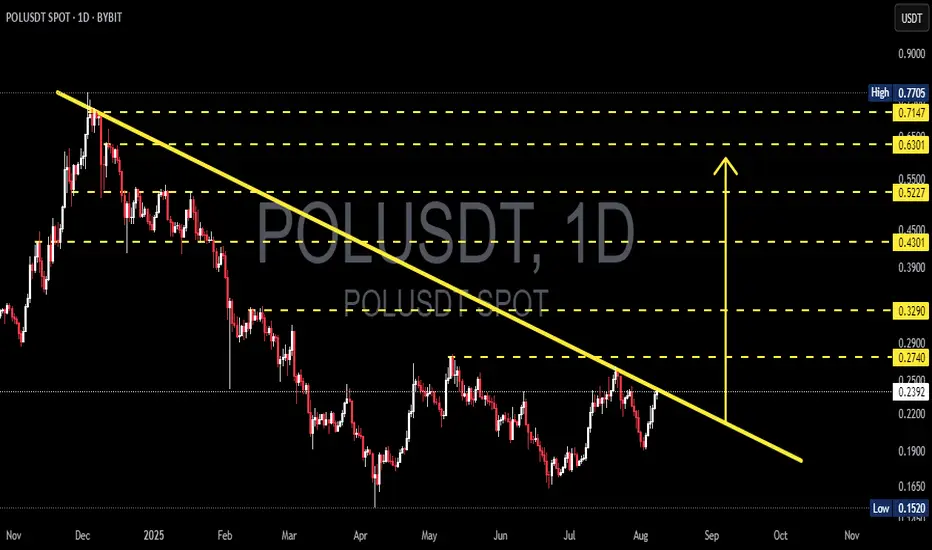
POL/USDT is currently showing signs of a potential trend reversal after months of sustained bearish momentum. The price is now testing a long-term descending trendline that has acted as a strong resistance since the November 2024 peak — and this moment could be a critical turning point for the market.
---
📌 Pattern Structure & Technical Setup:
🔸 Primary Pattern: Descending Trendline, capping every rally since late 2024.
🔸 Potential Reversal Structure: Falling Wedge Pattern – often a bullish reversal signal, supported by weakening bearish pressure and a series of higher lows forming since June 2025.
🔸 Current Position: Price is testing the trendline resistance around the $0.24–$0.27 zone.
---
📍 Key Price Levels:
✅ Resistance:
$0.2740 → Key breakout level; confirmation of trendline break.
$0.3290 → Important horizontal level, previously acted as major support.
$0.4301 – $0.7147 → Extended bullish targets based on Fibonacci retracement and historical price memory zones.
🛑 Support:
$0.2200 → Minor support if price rejects the trendline.
$0.1520 → Major long-term support (current all-time low).
---
📈 Bullish Scenario (Breakout Case):
If price successfully breaks and closes above $0.2740, we could expect:
Confirmation of a long-term downtrend breakout.
A shift in market sentiment from bearish to bullish.
Short-term target: $0.3290 → then $0.4301.
Higher upside potential if volume supports the breakout and altcoin momentum strengthens.
> 🚀 Volume will be the key validator – a breakout without volume = weak signal.
---
📉 Bearish Scenario (Rejection Case):
If the price fails to break the trendline:
Likely rejection and pullback toward the $0.2200 support zone.
If selling pressure increases, a retest of the $0.1520 demand zone is possible.
This would extend the consolidation phase or confirm continued bearish control over the medium term.
---
🔍 Conclusion & Trading Strategy:
POL/USDT is at a technical decision point. A confirmed breakout could mark the end of the accumulation/distribution phase and trigger a new bullish leg.
📌 Strategy Overview:
Breakout Traders: Enter after confirmed daily close above $0.2740, target levels above.
Reversal Traders: Enter conservatively after a retest of the breakout zone with a tight SL.
Bearish Traders: Consider shorts on strong rejection at the trendline, targeting $0.22 → $0.15.
---
🧠 Extra Notes:
Watch Bitcoin dominance and overall market sentiment.
Volume confirmation is crucial for validating breakout strength.
Be cautious of fakeouts, especially around dynamic resistance like trendlines.
#POLUSDT #CryptoBreakout #FallingWedge #AltcoinAnalysis #TechnicalAnalysis #CryptoSetup #PriceActionTrading #BullishBreakout #BearishScenario #CryptoReversal #TrendlineBreakout
✅ Get Free Signals! Join Our Telegram Channel Here: t.me/TheCryptoNuclear
✅ Twitter: twitter.com/crypto_nuclear
✅ Join Bybit : partner.bybit.com/b/nuclearvip
✅ Benefits : Lifetime Trading Fee Discount -50%
✅ Twitter: twitter.com/crypto_nuclear
✅ Join Bybit : partner.bybit.com/b/nuclearvip
✅ Benefits : Lifetime Trading Fee Discount -50%
Disclaimer
The information and publications are not meant to be, and do not constitute, financial, investment, trading, or other types of advice or recommendations supplied or endorsed by TradingView. Read more in the Terms of Use.