#POND/USD
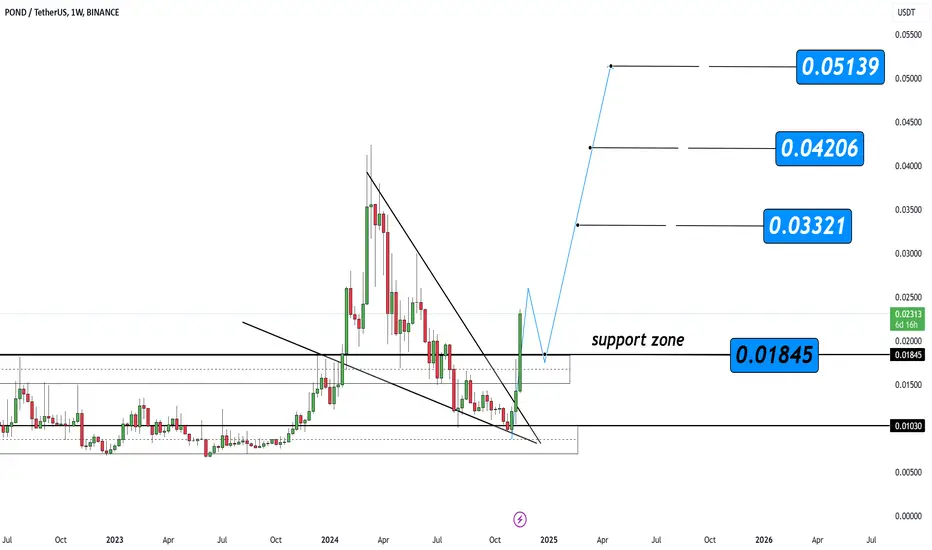
The chart for PPOND/USDT suggests a breakout from a descending wedge pattern, signaling potential bullish momentum. Key levels to watch are:
Target 1: $0.03349
Target 2: $0.04249
Support Zone: Around $0.01500, acting as a critical retest area.
Recommendations:
Entry: After retest near the support zone.
Subscribe to my Telegram Channel 👉 :
t.me/addlist/y5mi70s3c0Y3MDQ0
Subscribe to my X 👉 : x.com/VIPROSETR
t.me/addlist/y5mi70s3c0Y3MDQ0
Subscribe to my X 👉 : x.com/VIPROSETR
Disclaimer
The information and publications are not meant to be, and do not constitute, financial, investment, trading, or other types of advice or recommendations supplied or endorsed by TradingView. Read more in the Terms of Use.