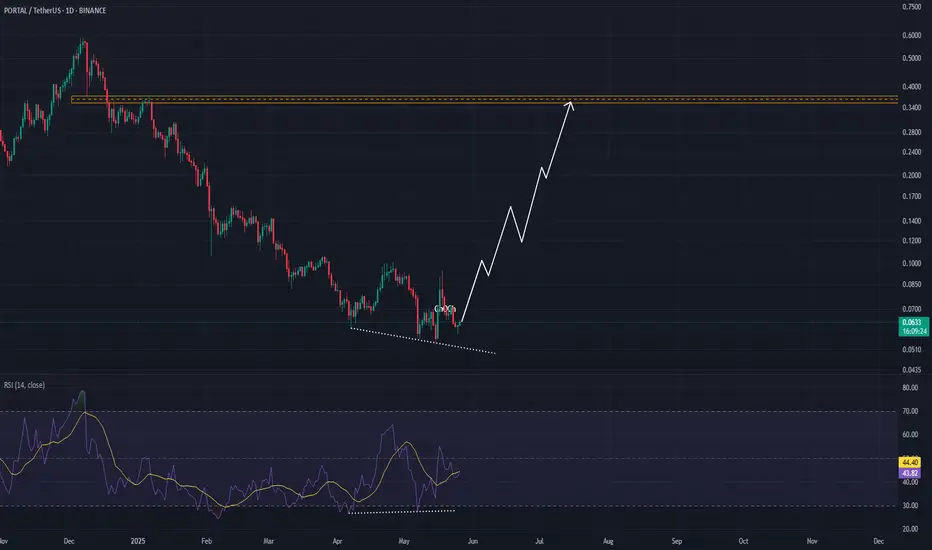
🔹 Price Action Overview:
Downtrend Continuation:
PORTAL has been in a consistent downtrend since its peak near $0.38, forming lower highs and lower lows. The price is currently trading at $0.0632, showing signs of temporary support formation.
Falling Wedge / Bullish Reversal Setup:
A descending structure (dotted trendline) is visible, suggesting a potential falling wedge—a classic bullish reversal pattern. This is further supported by a flattening bottom with diminishing bearish momentum.
🔸 RSI Analysis (Relative Strength Index):
RSI Divergence:
A bullish divergence is forming between price and the RSI:
Price is printing lower lows.
RSI is forming higher lows.
This often signals weakening selling pressure and a possible reversal if confirmed with bullish price action.
RSI Value:
Current RSI sits at 43.72, with the signal line at 44.39. It’s nearing the neutral 50 level, and a crossover above this may confirm bullish intent.
🟧 Resistance Zone:
Major Supply Zone:
The area around $0.34–$0.38 is marked as a key resistance (orange zone) from the previous top. If the reversal confirms, this zone will act as the primary bullish target.
🧠 Conclusion:
Bias: Neutral to Bullish
Key Confirmation: A breakout above short-term resistance (around $0.07–$0.075) on strong volume and an RSI breakout above 50 could confirm a trend reversal.
Invalidation: A breakdown below the wedge support and RSI slipping under 40 would invalidate the bullish setup and continue the bearish trend.
Stop loss 1DAY candle close under 0.0540$
Disclaimer
The information and publications are not meant to be, and do not constitute, financial, investment, trading, or other types of advice or recommendations supplied or endorsed by TradingView. Read more in the Terms of Use.
Disclaimer
The information and publications are not meant to be, and do not constitute, financial, investment, trading, or other types of advice or recommendations supplied or endorsed by TradingView. Read more in the Terms of Use.