Hello there,
*Mars Signals Team wishes you high profits*
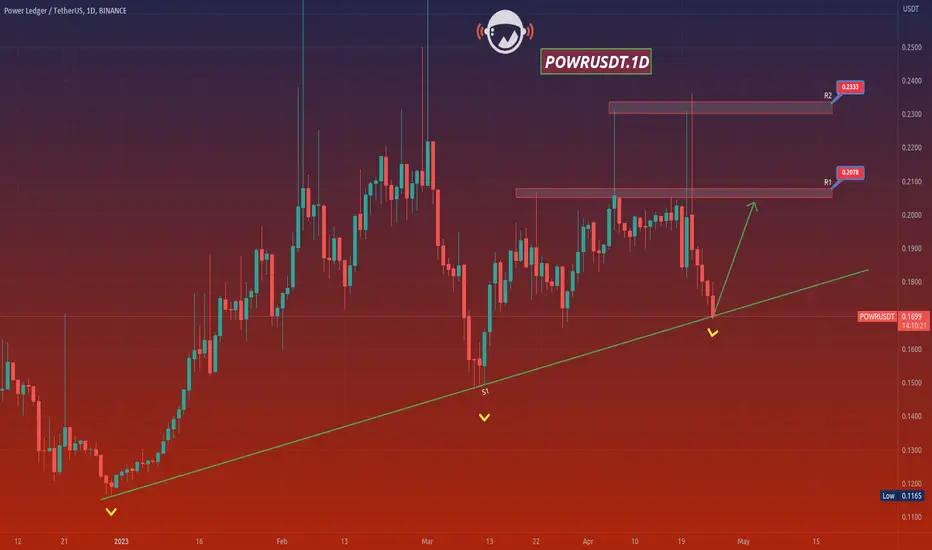
This is a one-day-time frame analysis for POWRUSDT
In this chart, R1 and R2 are our resistance areas in which the unsuccessful triumphs of price is clearly seen. And finally at the bottom of the chart, we have S1 that is the long-term support line and expresses the support of price at different points since the past. The price past trend illustrates its support at two points at S1 and after each support, it faced more rise to higher amounts including R1 and R2. After its lat ejection at R1, now the price is moving over S1 again. Hence, the price is fluctuating at this point and experience a rise up to the resistance areas. These will be the good points for saving your profits. Or if possibly the price is not supported again and falls below S1, it faces a decline to lower amounts via receiving some confirmation candles in order to fall. Note that it is recommended to wait for the price to reach S1 and then put their trade orders; for those who are seeking higher risks. In case you are interested in experiencing profitable trades and wise actions in your analyses, we have several points and tips in our updates.
Warning: This is just a suggestion and we do not guarantee profits. We advise you to analyze the chart before opening any positions.
Wish you success
*Mars Signals Team wishes you high profits*
This is a one-day-time frame analysis for POWRUSDT
In this chart, R1 and R2 are our resistance areas in which the unsuccessful triumphs of price is clearly seen. And finally at the bottom of the chart, we have S1 that is the long-term support line and expresses the support of price at different points since the past. The price past trend illustrates its support at two points at S1 and after each support, it faced more rise to higher amounts including R1 and R2. After its lat ejection at R1, now the price is moving over S1 again. Hence, the price is fluctuating at this point and experience a rise up to the resistance areas. These will be the good points for saving your profits. Or if possibly the price is not supported again and falls below S1, it faces a decline to lower amounts via receiving some confirmation candles in order to fall. Note that it is recommended to wait for the price to reach S1 and then put their trade orders; for those who are seeking higher risks. In case you are interested in experiencing profitable trades and wise actions in your analyses, we have several points and tips in our updates.
Warning: This is just a suggestion and we do not guarantee profits. We advise you to analyze the chart before opening any positions.
Wish you success
Disclaimer
The information and publications are not meant to be, and do not constitute, financial, investment, trading, or other types of advice or recommendations supplied or endorsed by TradingView. Read more in the Terms of Use.
Disclaimer
The information and publications are not meant to be, and do not constitute, financial, investment, trading, or other types of advice or recommendations supplied or endorsed by TradingView. Read more in the Terms of Use.