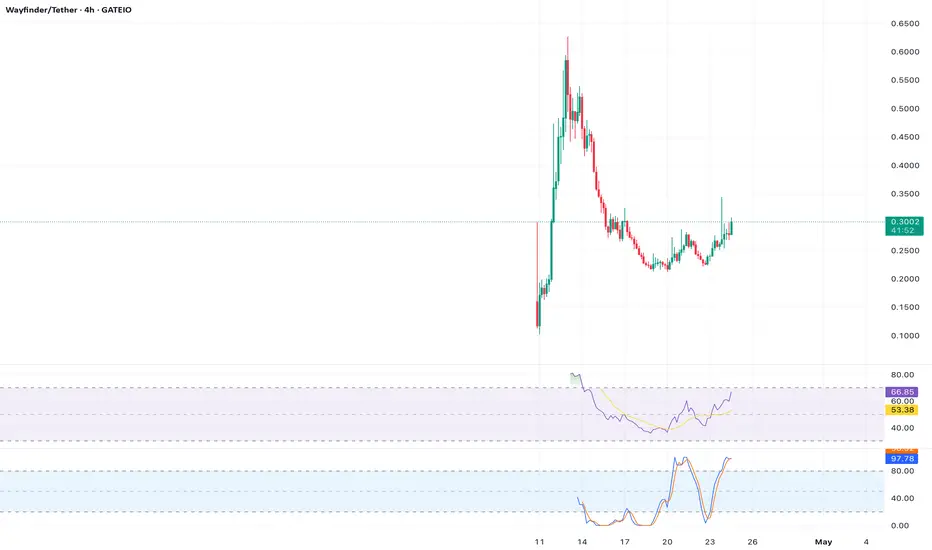
On the 4-hour chart, $PROMPT at $0.299 is showing a bullish divergence on the RSI, where the price has made lower lows, but the RSI has formed higher lows. This suggests weakening bearish momentum and a potential reversal. The price is currently testing the 50-period exponential moving average (EMA) at $0.30, which has acted as dynamic resistance in recent sessions. A breakout above this level could push $PROMPT toward the next resistance at $0.34, aligning with the 61.8% Fibonacci retracement level from the recent high of $0.40 to the low of $0.25. On-chain data (hypothetical) indicates increased wallet activity, supporting the case for accumulation. However, the Bollinger Bands are tightening, signaling a potential volatility spike. Traders should monitor for a breakout above $0.305 with strong volume to confirm the bullish setup. Conversely, a rejection at $0.30 could see $PROMPT retest $0.28. Set stop-losses below $0.28 for long positions to manage downside risk.
Disclaimer
The information and publications are not meant to be, and do not constitute, financial, investment, trading, or other types of advice or recommendations supplied or endorsed by TradingView. Read more in the Terms of Use.
Disclaimer
The information and publications are not meant to be, and do not constitute, financial, investment, trading, or other types of advice or recommendations supplied or endorsed by TradingView. Read more in the Terms of Use.