Short
$PS 5 Month #Rectanle #ChartPattern
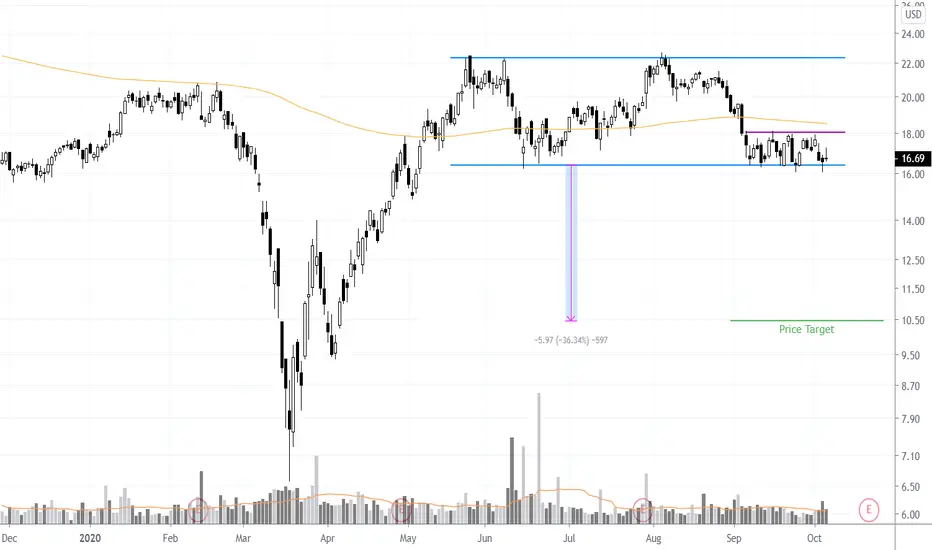
Another short I'm tracking for this week is $NASDAQ:PS.
It formed a 5 month rectangle with $16.40 acting as support. The stock broke the 200 MA and been consolidating right below it forming a month long rectangle failing to stage a meaningful bounce from rectangle lower boundary with $18 acting as strong resistance.
A clear close below $16.40 will complete the 5 month rectangle chart pattern and trigger a short entry.
Chart pattern price target added to chart.
✔ Momentum & Breakout Trader Since 2006 | Influenced by Mark Minervini VCP Trading Style & William O'Neil CANSLIM 📈
✔ Follow me on Twitter @taplot - twitter.com/TaPlot
✔ YouTube channel youtube.com/@taplot
✔ Follow me on Twitter @taplot - twitter.com/TaPlot
✔ YouTube channel youtube.com/@taplot
Disclaimer
The information and publications are not meant to be, and do not constitute, financial, investment, trading, or other types of advice or recommendations supplied or endorsed by TradingView. Read more in the Terms of Use.