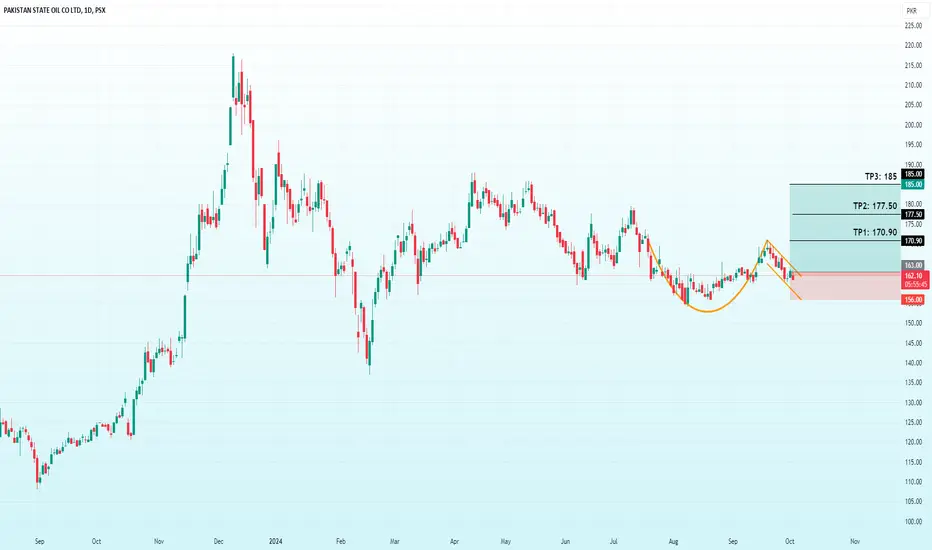
The chart depicts the stock price movement of Pakistan State Oil (PSO) Ltd on a daily timeframe. It shows the formation of a cup-and-handle pattern, a bullish reversal pattern. The "cup" part indicates a gradual downtrend followed by a recovery, and the "handle" suggests a brief consolidation. The price is currently in the handle formation, and the key levels to watch are the target points (TP1: 170.90, TP2: 177.50, and TP3: 185) based on the expected upward breakout. However, there's a potential downside risk with a support level around 156. If the price breaks below this support, it could invalidate the bullish setup.
Trade active
TP1 Achieved 🚀🚀🚀Trade closed: target reached
Trade closed at 184 🚀🚀🚀Disclaimer
The information and publications are not meant to be, and do not constitute, financial, investment, trading, or other types of advice or recommendations supplied or endorsed by TradingView. Read more in the Terms of Use.
Disclaimer
The information and publications are not meant to be, and do not constitute, financial, investment, trading, or other types of advice or recommendations supplied or endorsed by TradingView. Read more in the Terms of Use.