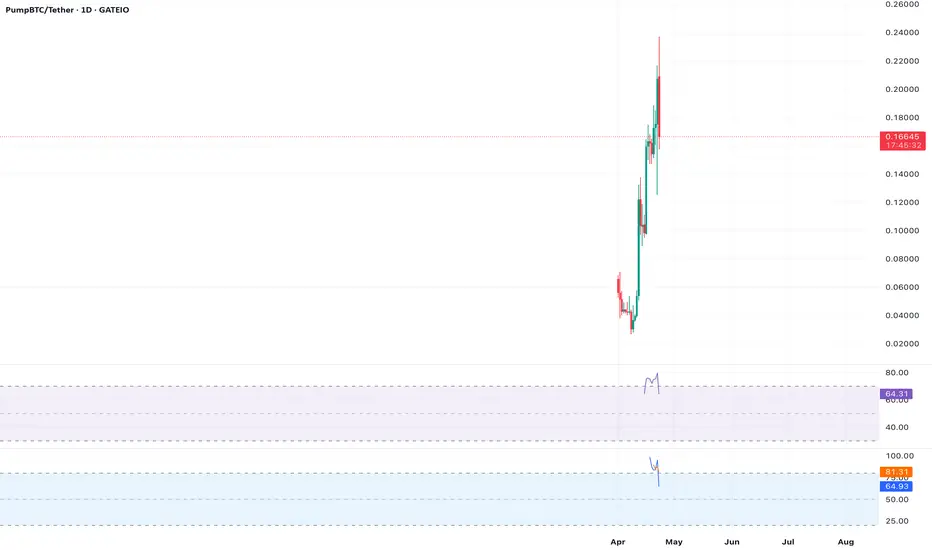
$PUMP at $0.167 Tests Key Resistance – Breakout or Rejection?
Analysis:  PUMP is currently trading at $0.167, approaching a significant resistance zone around $0.17, which has acted as a ceiling in recent trading sessions. On the 4-hour chart, the price is forming higher highs and lows, indicating a bullish trend since breaking above the $0.13 support in early April (as suggested by X posts). The Relative Strength Index (RSI) is at 68, close to overbought levels, signaling caution for short-term longs. However, the Moving Average Convergence Divergence (MACD) shows a bullish crossover, with the MACD line above the signal line, supporting potential upside. Volume analysis indicates a 24-hour spike, aligning with increased market activity on Solana-based tokens. A breakout above $0.17 could target $0.20, the next psychological level, but failure to hold $0.16 may lead to a pullback toward the 50-day moving average at $0.14. Traders should monitor Solana’s ecosystem sentiment and set stop-losses below $0.15 to mitigate downside risk.
Key Levels:
Resistance: $0.17, $0.20
Support: $0.15, $0.14
Recommendation: Watch for a close above $0.17 with strong volume for long entries; avoid chasing if RSI exceeds 70.
Key Levels:
Resistance: $0.17, $0.20
Support: $0.15, $0.14
Recommendation: Watch for a close above $0.17 with strong volume for long entries; avoid chasing if RSI exceeds 70.
Disclaimer
The information and publications are not meant to be, and do not constitute, financial, investment, trading, or other types of advice or recommendations supplied or endorsed by TradingView. Read more in the Terms of Use.
Disclaimer
The information and publications are not meant to be, and do not constitute, financial, investment, trading, or other types of advice or recommendations supplied or endorsed by TradingView. Read more in the Terms of Use.