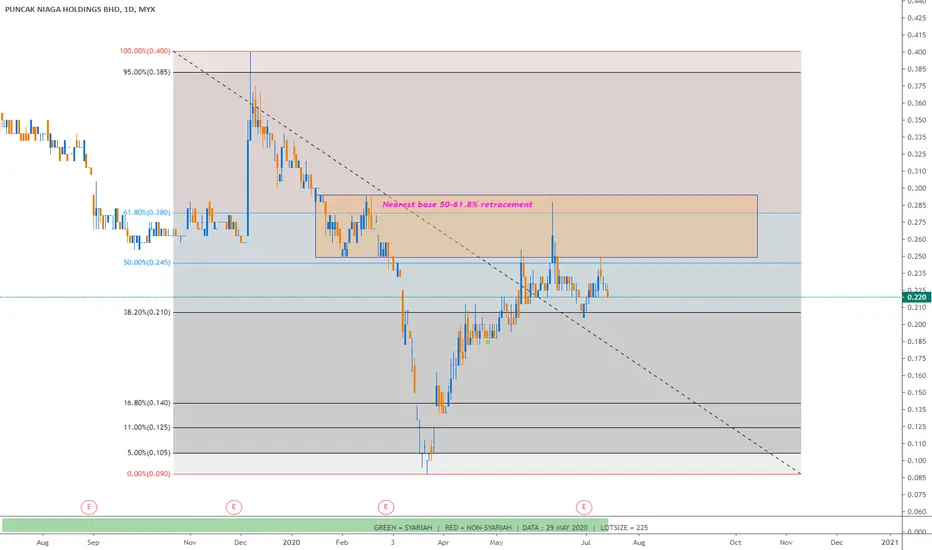
As you can see on this chart, i want to share something interesting.
Today i applied this method also on other counters and most of them show the same results.
As you can see, price already reached fibo retracement level 50-61.8% which i believe many other traders who are using fibo will also noticed this same pattern.
Usually price will take a break from here,in other word retracement will happened once price reached this level.
This method is simple, find the nearest base between fibo retracement 50-61.8%. Sometimes the base could be below/above 61.8%.
Since this is a long term view, intraday traders may not applied.
Just be careful with indices as they are approaching peak value
Note
Where To buy?
Best and safest place to enter when price retrace back to 50-61.8% retracement. Find the nearest base around this level
Note
Others example
Note
EFORCE- Take a break once reached 50-61.8%
Note
Retrace from here
Best area to buy
Note
Note
Note
Note
Note
Note
Disclaimer
The information and publications are not meant to be, and do not constitute, financial, investment, trading, or other types of advice or recommendations supplied or endorsed by TradingView. Read more in the Terms of Use.
Disclaimer
The information and publications are not meant to be, and do not constitute, financial, investment, trading, or other types of advice or recommendations supplied or endorsed by TradingView. Read more in the Terms of Use.