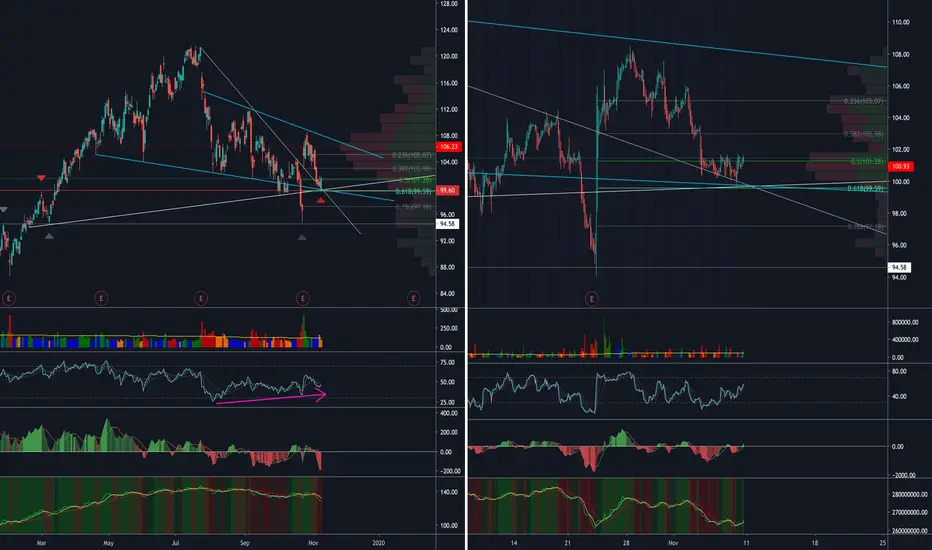
At first glance this chart is a bit of a mess. There are many intermingling trend-lines, but my eyes are drawn to a falling wedge which I have colored with blue to help it stand out. After some analysis, Friday's (11/8) candle has bounced in a very interesting place. Prior resistance (red line & arrows), a newly confirmed up-trend (light-gray), our blue down trend and the 61.8% retracement.
Decent volume on this bounce, comparable to previous bounces along this trend-line.
RSI appears to be confirming the move.
I think we chop below $102 for a few days but eventually revisit the falling wedge top.
Decent volume on this bounce, comparable to previous bounces along this trend-line.
RSI appears to be confirming the move.
I think we chop below $102 for a few days but eventually revisit the falling wedge top.
Note
My 102 comment was a little careless in hindsight.The volume profile doesn't show a lot of resistance until about 102.98.Note
As expected, we're at the top of the channel.Disclaimer
The information and publications are not meant to be, and do not constitute, financial, investment, trading, or other types of advice or recommendations supplied or endorsed by TradingView. Read more in the Terms of Use.
Disclaimer
The information and publications are not meant to be, and do not constitute, financial, investment, trading, or other types of advice or recommendations supplied or endorsed by TradingView. Read more in the Terms of Use.