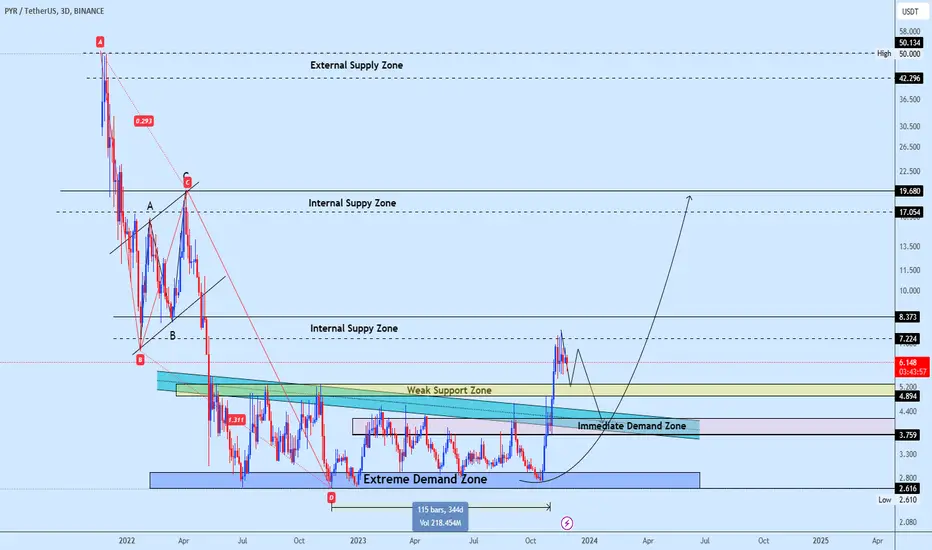
PYRUSDT displays a robust structure resembling a harmonic pattern AB=CD. The price witnessed substantial accumulation following the completion of leg D. After approximately 115 days of accumulation within a potential box-like pattern, a surprising breakout occurred, testing the supply levels towards the leg B of the pattern.
However, the resistance encountered within this supply area has hindered further upward movement, leading to a pullback towards the box neckline area. As the price descends, there's a notable weak support zone identified. Despite its label, this level holds significance and might propel the price upwards. Anticipation leans towards a pullback in an ABC pattern.
The immediate demand zone highlighted on the chart presents a robust area for potential buy opportunities. The outlined targets align with the supply zone illustrated on the chart.
Boosting this analysis and engaging with your comments is appreciated.
📢Follow the official links only! Trade smart, stay safe! 🎯
Telegram: t.me/+m0IACMn0ul03OTFk
Forex zone: t.me/+piiPgrNtrulkNDk0
💎 Premium details: t.me/wcsepayment
📩 Promotion/Partnership: t.me/WESLAD
Telegram: t.me/+m0IACMn0ul03OTFk
Forex zone: t.me/+piiPgrNtrulkNDk0
💎 Premium details: t.me/wcsepayment
📩 Promotion/Partnership: t.me/WESLAD
Disclaimer
The information and publications are not meant to be, and do not constitute, financial, investment, trading, or other types of advice or recommendations supplied or endorsed by TradingView. Read more in the Terms of Use.