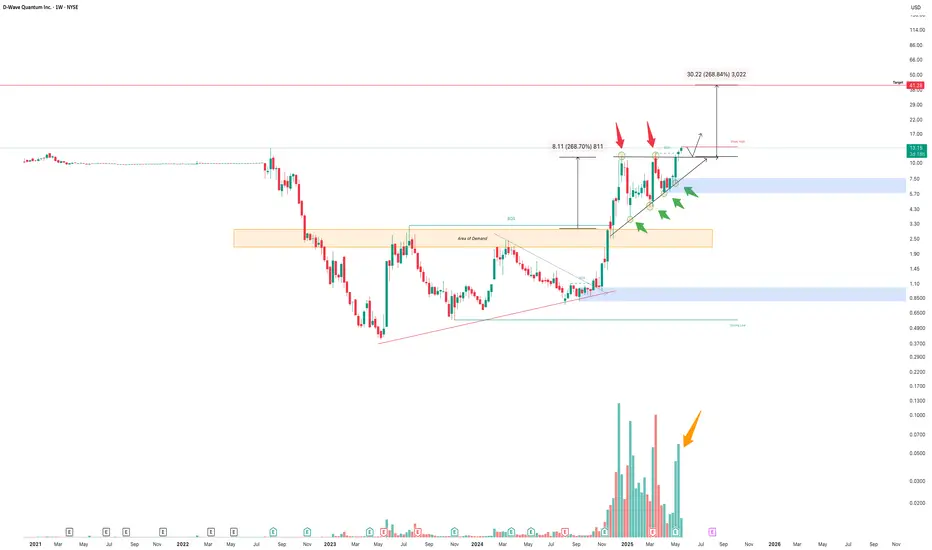
This chart shows a clear ascending triangle breakout on the weekly timeframe
Strong resistance around $13, tested multiple times (red arrows).
Rising trendline support (green arrows), forming the ascending base.
A large volume surge (highlighted by orange arrow) on the breakout candle, validating institutional interest and confirming the pattern.
The measured move projection targets a rally toward $41.28, representing a potential 268% upside from the breakout zone.
This structure suggests a bullish continuation, provided the price holds above the breakout zone ($11.13–$13.00).
Trade active
Great Breakout with Volume! Lets Go!
Note
Dont chase price . Wait for a retest of previous resistance . Overbought on the daily but weekly trend is strong . Note
Look at that 5Day
Don't go against momentum
Note
Price looks to be exhausted in the near term. Save some for a potential retest of the ascending triangle .
Note
Are you willing to wait ?
Note
Price has found strong support above value gap. If price bounces from this support again and breaks upper resistance price will resume uptrend .
Only a daily close below this support will open doors for ascending triangle retest .
Disclaimer
The information and publications are not meant to be, and do not constitute, financial, investment, trading, or other types of advice or recommendations supplied or endorsed by TradingView. Read more in the Terms of Use.
Disclaimer
The information and publications are not meant to be, and do not constitute, financial, investment, trading, or other types of advice or recommendations supplied or endorsed by TradingView. Read more in the Terms of Use.