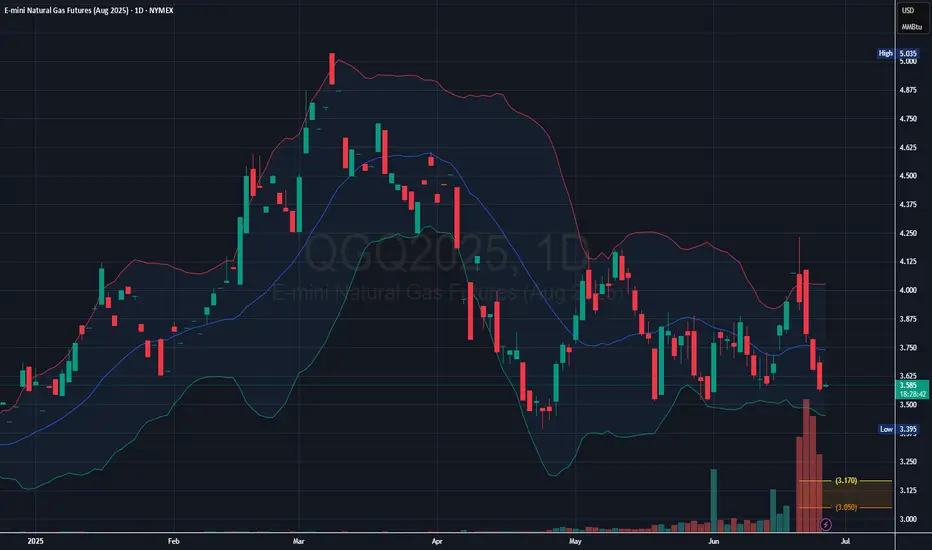
Natural Gas Futures Signal Breakdown Below Mid-Band Support

- The most recent candle closed below the middle Bollinger Band (20 SMA), indicating potential downside momentum.
- The price recently spiked toward the upper band (~$4.20) but was strongly rejected, creating a bearish reversal pattern.
- Volume has been increasing on down days, especially the last few sessions, suggesting institutional selling pressure.
➀➁➂➃➄
Disclaimer
The information and publications are not meant to be, and do not constitute, financial, investment, trading, or other types of advice or recommendations supplied or endorsed by TradingView. Read more in the Terms of Use.
➀➁➂➃➄
Disclaimer
The information and publications are not meant to be, and do not constitute, financial, investment, trading, or other types of advice or recommendations supplied or endorsed by TradingView. Read more in the Terms of Use.