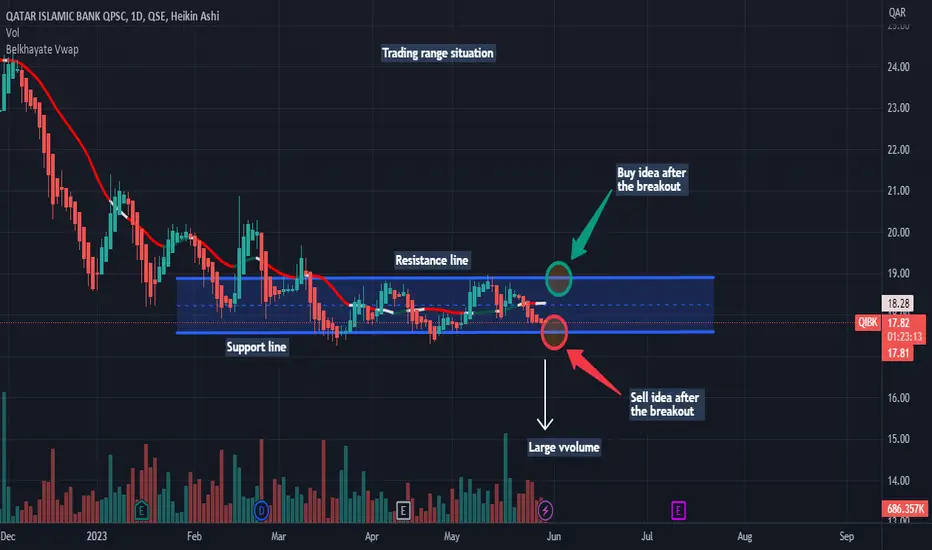
On QIBK as you see on the chart we are in a trading range situation. If we have the breakout with force the vwap indicator and the resistance line by a big green candle with a large green volume it's mean that we will have a big probability to have an uptrend. In other hand, if we have the breakout with force the support line by a big red candle with a large red volume it's mean that we will have a big probability to have a downtrend...Thanks!
Disclaimer
The information and publications are not meant to be, and do not constitute, financial, investment, trading, or other types of advice or recommendations supplied or endorsed by TradingView. Read more in the Terms of Use.
Disclaimer
The information and publications are not meant to be, and do not constitute, financial, investment, trading, or other types of advice or recommendations supplied or endorsed by TradingView. Read more in the Terms of Use.