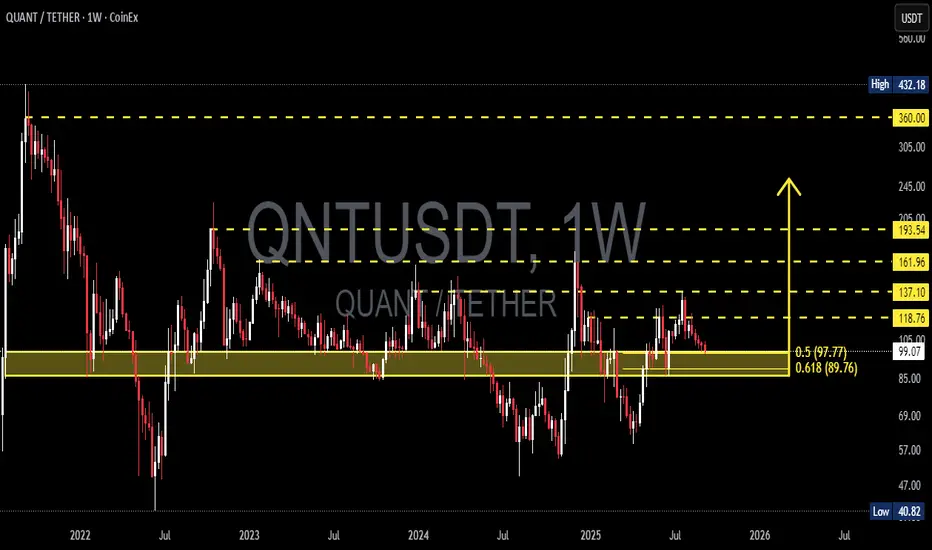
QNT is currently retesting a historical demand zone in the range of $89.76 – $97.77 (Fibonacci 0.5–0.618 confluence). This level has repeatedly acted as a strong pivot point since 2022, and now the market faces yet another decisive moment.
---
🔎 Technical Analysis
Long-Term Trend: Since topping around ~$432, QNT has been in a broader downtrend forming lower highs. However, since 2023 the market has shifted into a sideways accumulation phase above the $80–$100 range.
Key Zone: The highlighted yellow zone ($89.76 – $97.77) is a pivotal demand area. Holding this level could trigger a strong rebound, but a breakdown below would expose much lower targets.
Nearest Resistances: $118.76 → $137.10 → $161.96 → $193.54
Extreme Supports: $70.00 → $40.82
---
✅ Bullish Scenario
Confirmation: A strong weekly close above the demand zone, followed by bullish continuation candles with volume.
Stage 1 Target: $118.76 (≈ +32% upside from $89.76)
Stage 2 Targets: $137.10 → $161.96 → $193.54 if momentum accelerates.
Pattern Outlook: Potential double bottom / re-accumulation structure on the weekly timeframe, waiting for breakout confirmation above key resistance.
---
⚠️ Bearish Scenario
Risk: A weekly close below $89.76 (0.618 Fib) would confirm breakdown of the demand zone.
Downside Targets: $70.00 as the next support, with a potential retest of the historical low at $40.82 if bearish pressure intensifies.
Pattern Outlook: A breakdown here could trigger long liquidation cascades and accelerate the bearish trend.
---
📌 Setup & Risk Management
Aggressive Entry: Scale in within the $89–$98 range, but only with daily/weekly bullish confirmation (pin bar / engulfing close).
Conservative Entry: Wait for a confirmed breakout + weekly close above $118.76 to validate trend reversal.
Stop Loss: Below $84 (under the 0.618 Fib + historical wick support).
Risk-to-Reward Example: Entry $94, stop $84, target $118.76 → R:R ≈ 2.48 : 1.
---
🎯 Conclusion
The $89.76 – $97.77 demand zone is the make-or-break level for QNT in the mid-term outlook:
Hold → potential rebound rally towards $118–$193.
Break → bearish continuation likely, with targets down to $70 or even $40.
QNT is at a critical crossroads: will this demand zone once again spark a rally, or will it finally give way to a deeper breakdown?
---
#QNT #QNTUSDT #Quant #Crypto #TechnicalAnalysis #PriceAction #Fibonacci #SupportResistance #CryptoTrading #SwingTrade
---
🔎 Technical Analysis
Long-Term Trend: Since topping around ~$432, QNT has been in a broader downtrend forming lower highs. However, since 2023 the market has shifted into a sideways accumulation phase above the $80–$100 range.
Key Zone: The highlighted yellow zone ($89.76 – $97.77) is a pivotal demand area. Holding this level could trigger a strong rebound, but a breakdown below would expose much lower targets.
Nearest Resistances: $118.76 → $137.10 → $161.96 → $193.54
Extreme Supports: $70.00 → $40.82
---
✅ Bullish Scenario
Confirmation: A strong weekly close above the demand zone, followed by bullish continuation candles with volume.
Stage 1 Target: $118.76 (≈ +32% upside from $89.76)
Stage 2 Targets: $137.10 → $161.96 → $193.54 if momentum accelerates.
Pattern Outlook: Potential double bottom / re-accumulation structure on the weekly timeframe, waiting for breakout confirmation above key resistance.
---
⚠️ Bearish Scenario
Risk: A weekly close below $89.76 (0.618 Fib) would confirm breakdown of the demand zone.
Downside Targets: $70.00 as the next support, with a potential retest of the historical low at $40.82 if bearish pressure intensifies.
Pattern Outlook: A breakdown here could trigger long liquidation cascades and accelerate the bearish trend.
---
📌 Setup & Risk Management
Aggressive Entry: Scale in within the $89–$98 range, but only with daily/weekly bullish confirmation (pin bar / engulfing close).
Conservative Entry: Wait for a confirmed breakout + weekly close above $118.76 to validate trend reversal.
Stop Loss: Below $84 (under the 0.618 Fib + historical wick support).
Risk-to-Reward Example: Entry $94, stop $84, target $118.76 → R:R ≈ 2.48 : 1.
---
🎯 Conclusion
The $89.76 – $97.77 demand zone is the make-or-break level for QNT in the mid-term outlook:
Hold → potential rebound rally towards $118–$193.
Break → bearish continuation likely, with targets down to $70 or even $40.
QNT is at a critical crossroads: will this demand zone once again spark a rally, or will it finally give way to a deeper breakdown?
---
#QNT #QNTUSDT #Quant #Crypto #TechnicalAnalysis #PriceAction #Fibonacci #SupportResistance #CryptoTrading #SwingTrade
✅ Get Free Signals! Join Our Telegram Channel Here: t.me/TheCryptoNuclear
✅ Twitter: twitter.com/crypto_nuclear
✅ Join Bybit : partner.bybit.com/b/nuclearvip
✅ Benefits : Lifetime Trading Fee Discount -50%
✅ Twitter: twitter.com/crypto_nuclear
✅ Join Bybit : partner.bybit.com/b/nuclearvip
✅ Benefits : Lifetime Trading Fee Discount -50%
Disclaimer
The information and publications are not meant to be, and do not constitute, financial, investment, trading, or other types of advice or recommendations supplied or endorsed by TradingView. Read more in the Terms of Use.