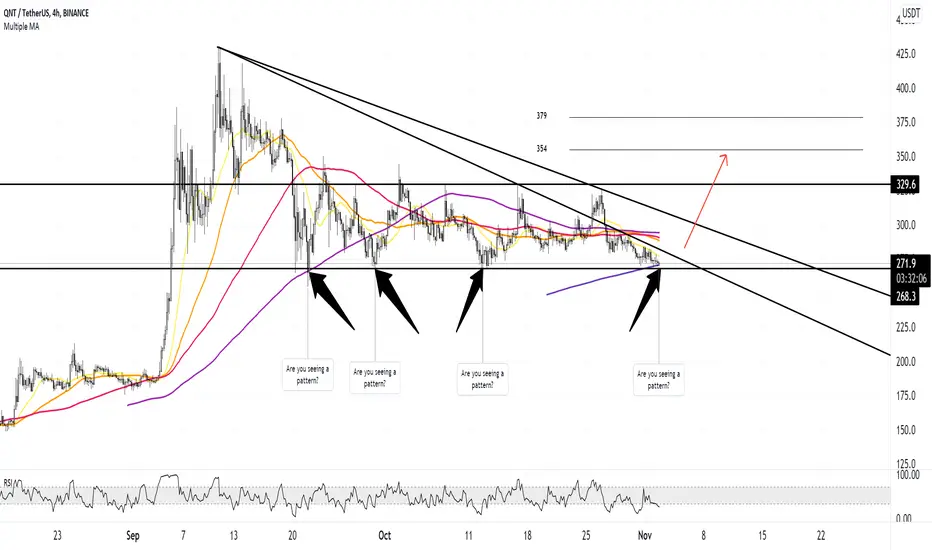
Let's point out the obvious - are you seeing a pattern?
It's stuck in a parallel channel as highlighted by the black box it's in.
Every time it touches the bottom, it goes up to ~$310.
We are touching the bottom again, and if three time wasn't the charm, now's the 4th time. However what's so special this time?
We have the MA 500 acting as very strong support, and you can clearly see it on the chart. This is dark purple line forming. This indicates a lot of selling pressure is subsiding, and buying will start from here on out.
What is an additional bullish formation here? The resistance line is part of a steeper bullish triangle, and it is just getting super squeezed at the end of this triangle. We have a large triangle right above it, but I'm expecting a move to $320 coming again.
TP levels highlighted on the chart.
Stop loss at 250.
Disclaimer
The information and publications are not meant to be, and do not constitute, financial, investment, trading, or other types of advice or recommendations supplied or endorsed by TradingView. Read more in the Terms of Use.
Disclaimer
The information and publications are not meant to be, and do not constitute, financial, investment, trading, or other types of advice or recommendations supplied or endorsed by TradingView. Read more in the Terms of Use.